
In today’s rapidly evolving digital landscape, securing sensitive data and networks has become paramount. Among the arsenal of tools designed to fortify these defenses, Wazuh emerges as a robust and versatile solution. TryHackMe briefly introduced Wazuh in a separate room within the Endpoint Security Monitoring Module, which is part of their learning path to SOC Level 1.
After just scratching the surface, I wanna delve deeper about this tool. While the exact number of upcoming blog posts remains uncertain, I’m excited to navigate this journey, unearthing Wazuh’s capabilities and evaluating them in the controlled environment of my home lab
My intent is to gain a semblance of real-life experience in protecting environments with Wazuh’s features, and refine my skills in endpoint monitoring and protection. So far, I’ve experimented with nearly half of its capabilities in my home lab environment, and I’ve come to realize, that I’ve only scratched the surface too.
In this initial installment, I will be covering the following areas:
- Brief intro to Wazuh,
- Explore the Core components, and
- Provide an overview of the main capabilities.
Introduction
Wazuh was created in 2015 as an open source security platform that offers unified XDR and SIEM protection across on-premise, virtualized, containerized, and cloud-based workloads. Some of its capabilities include log data analysis, intrusion and malware detection, file integrity monitoring, etc. The solution is composed of three central components and one universal agent. Version 4.4 is what I will be using in this home lab.
Components
As mentioned, Wazuh operates with three central components: A server, an indexer, and a dashboard, and a single universal agent, which is deployed on endpoints for the purpose of monitoring.
Wazuh indexer
The indexer is responsible for indexing and storing alerts generated by the Wazuh server. It can be configured as a single-node or multi-node cluster. Data are then stored in JSON.
These are the four different indices used to store different types of events
- wazuh-alerts– These are alerts generated the the Wazuh server every time an event triggers a rule
- wazuh-archives– These are the stored events whether or not they trigger a rule.
- wazuh-monitoring– These are the stored data in relation to an agent’s status. They can be
Active,Disconnected, orNever connected - wazuh-statistics– These are the stored data that pertains to the server’s performance.
Interacting with the indexer can be initiated with its REST API. Tasks include searching, adding or deleting documents, modifying indices, and more.

Once data is received from the agents, the server analyzes them with decoders and rules to look for well-known indicators of compromise (IOCs), and triggering alerts when threats or anomalies are detected. Managing, configuring, and upgrading agents are also done in the server.
Wazuh server
Its detection capabilities are improved by utilizing threat intelligence sources. MITRE ATT&CK framework and regulatory compliance requirements such as PCI DSS, GDPR, HIPAA, CIS, and NIST 800-53 are likewise used to enhance its alert data.
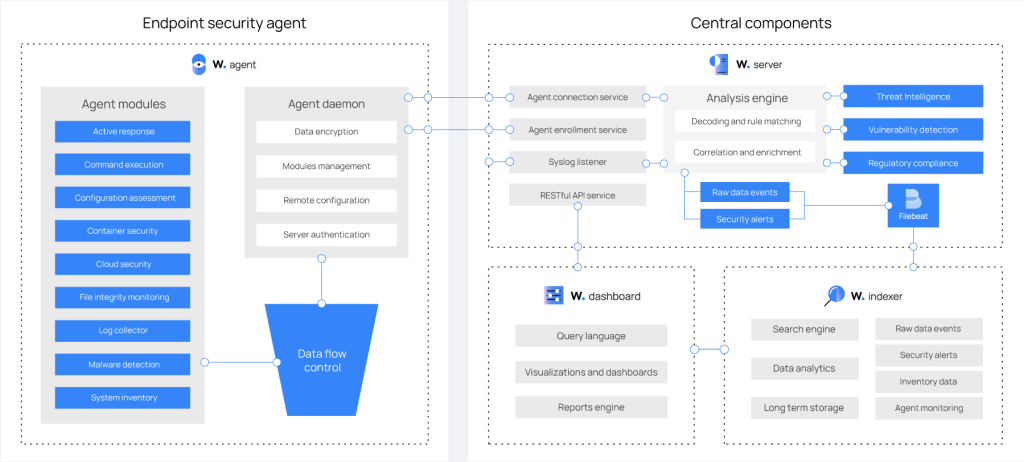
Server architecture
The Wazuh server runs six components: the analysis engine, the Wazuh RESTful API, the agent enrollment service, the agent connection service, the Wazuh cluster daemon, and Filebeat. The server is installed on a Linux operating system and usually runs on a stand-alone physical machine, virtual machine, docker container, or cloud instance.
The image below shows the server architecture and components.

Server components
The components serve different purposes:
- Agent enrollment service: It is used to enroll new agents. This service provides and distributes unique authentication keys to each agent.
- Agent connection service: This service receives data from the agents. This service also provides centralized configuration management, enabling pushing new agent settings remotely.
- Analysis engine: This component performs the data analysis. Decoders are used to identify the type of information being processed (Windows events, SSH logs, web server logs, and others). These decoders also extract relevant data elements from the log messages, such as source IP address, event ID, or username. Then, by using rules, the engine identifies specific patterns in the decoded events that could trigger alerts and possibly even call for an active response.
- Wazuh RESTful API: This service provides an interface to interact with the Wazuh infrastructure. It is used to manage configuration settings of agents and servers, monitor the infrastructure status and overall health, manage and edit Wazuh decoders and rules, and query about the state of the monitored endpoints. The Wazuh dashboard also uses it.
- Wazuh cluster daemon: This service is used to scale Wazuh servers horizontally, deploying them as a cluster. This kind of configuration, combined with a network load balancer, provides high availability and load balancing. The Wazuh cluster daemon is what Wazuh servers use to communicate with each other and to keep synchronized.
- Filebeat: It is used to send events and alerts to the Wazuh indexer. It reads the output of the Wazuh analysis engine and ships events in real time. It also provides load balancing when connected to a multi-node Wazuh indexer cluster.
Wazuh dashboard
Data visualization and analysis happen in the dashboard with a web user interface. It include dashboards for security events, regulatory compliance, detected vulnerable applications, file integrity monitoring data, among others. Managing Wazuh’s configuration and monitoring its status are likewise done in the dashboard.
Data visualization and analysis
The web interface helps users navigate through the different types of data collected by the Wazuh agent, as well as the security alerts generated by the Wazuh server. The dashboard also offer the ability to generate reports and create custom visualizations and dashboards.


Agents monitoring and configuration
This dashboard allows management of agents configuration and status monitoring.

Wazuh agents
For Wazuh to perform its powerful capabilities, agents are deployed on endpoints. Endpoints include laptops, desktops, servers, cloud instances, or virtual machines. Agents can run on Linux, Windows, macOS, solaris, AIX, and other operating systems. These systems are protected by the agent, providing threat prevention, detection, and response capabilities.
Agent architecture
The Wazuh agent has a modular architecture. Each component is in charge of its own tasks, including monitoring the file system, reading log messages, collecting inventory data, scanning the system configuration, and looking for malware. Agent modules can be managed through the configuration settings particular to their needs.
The image below describes the agent architecture and components.
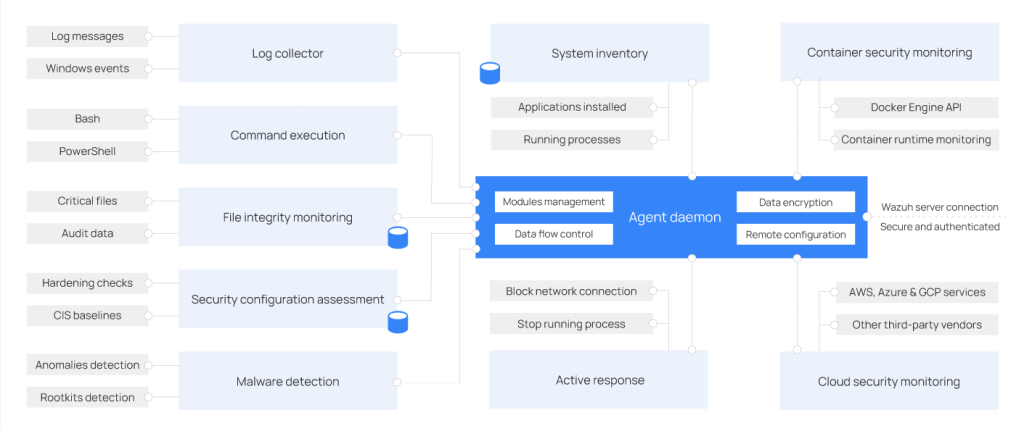
Agent modules
All agent modules are configurable and perform different security tasks. This modular architecture allows the ability to enable or disable each component according to the security needs. Below are the different purposes of all the agent modules.
- Log collector: This agent component can read flat log files and Windows events, collecting operating system and application log messages. It supports XPath filters for Windows events and recognizes multi-line formats like Linux Audit logs. It can also enrich JSON events with additional metadata.
- Command execution: Agents run authorized commands periodically, collecting their output and reporting it back to the Wazuh server for further analysis. You can use this module for different purposes, such as monitoring hard disk space left or getting a list of the last logged-in users.
- File integrity monitoring (FIM): This module monitors the file system, reporting when files are created, deleted, or modified. It keeps track of changes in file attributes, permissions, ownership, and content. When an event occurs, it captures who, what, and when details in real time. Additionally, the FIM module builds and maintains a database with the state of the monitored files, allowing queries to be run remotely.
- Security configuration assessment (SCA): This component provides continuous configuration assessment, utilizing out-of-the-box checks based on the Center of Internet Security (CIS) benchmarks. Users can also create their own SCA checks to monitor and enforce their security policies.
- System inventory: This agent module periodically runs scans, collecting inventory data such as operating system version, network interfaces, running processes, installed applications, and a list of open ports. Scan results are stored in local SQLite databases that can be queried remotely.
- Malware detection: Using a non-signature-based approach, this component is capable of detecting anomalies and the possible presence of rootkits. Also, it looks for hidden processes, hidden files, and hidden ports while monitoring system calls.
- Active response: This module runs automatic actions when threats are detected, triggering responses to block a network connection, stop a running process, or delete a malicious file. Users can also create custom responses when necessary and customize, for example, responses for running a binary in a sandbox, capturing network traffic, and scanning a file with an antivirus.
- Container security monitoring: This agent module is integrated with the Docker Engine API to monitor changes in a containerized environment. For example, it detects changes to container images, network configuration, or data volumes. Besides, it alerts about containers running in privileged mode and about users executing commands in a running container.
- Cloud security monitoring: This component monitors cloud providers such as Amazon AWS, Microsoft Azure, or Google GCP. It natively communicates with their APIs. It is capable of detecting changes to the cloud infrastructure (e.g., a new user is created, a security group is modified, a cloud instance is stopped, etc.) and collecting cloud services log data (e.g., AWS Cloudtrail, AWS Macie, AWS GuardDuty, Azure Active Directory, etc.)
Communication with Wazuh server
Logged data and security-related events are forwarded to the server.
Wazuh can also monitor devices such as firewall, switches, routers, or network IDS, in what they call as “agent-less” monitoring.
Wazuh’s components and data flow are represented in the image below.
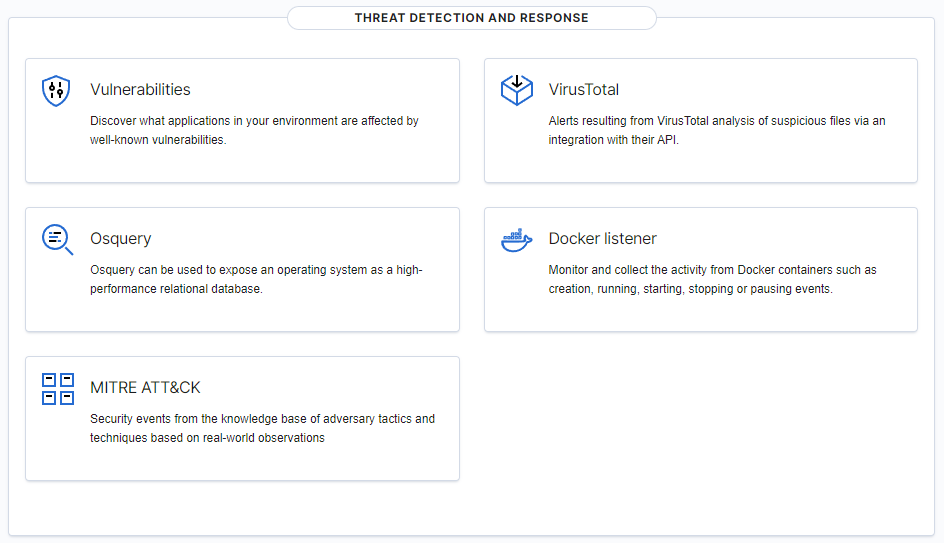
Capabilities
This section will cover Wazuh’s capabilities as a platform for security monitoring and management, i.e, for threat detection, integrity monitoring, real-time incident response, and compliance.
File Integrity Monitoring
File Integrity Monitoring or FIM, functions as a security feature for overseeing the systems’ and application files’ authenticity. With this capability, files, and directories that are being monitored for any creation, modification, or deletion will trigger an alert when such process happens. Files hashes and other attributes are stored in a local FIM database, and when discrepancies are identified after a scan, this would trigger an alert. For effective threat detection and response, FIM can be combined with Wazuh’s other capabilities.
Files and directories can be scanned periodically for any changes. Configurations should be made in the Wazuh agent and manager to specify which paths and directories are to be monitored.
Malware detection
FIM alone cannot detect the presence of malware/s in a system. That is why, FIM should be combined with threat detection rules, such as YARA, and threat intelligence sources, like VirusTotal and CDB’s list of file hashes, to detect malicious files and abnormal patterns, that shows the presence of malware.
Rootkits behavior detection
This module is used to detect the presence of malware by scanning an endpoint every 12 hours, which can be configured depending on the need of the environment. After an agent has been installed in an endpoint, the Rootkit module will monitor the specified paths, directories, registry entries, and system for abnormal behavior using out-of-the box rootkit signatures, which can also be modified to the frequency required. The logs will be sent to the manager for pre-decoding, and decoding analysis, and will match the logs to predefined rules.
These are the Rootcheck capabilities: check running processes for discrepancies, check hidden ports that a malware may use for c2 communication, check unusual files and permissions, check hidden files using system calls for comparing stat size and file size, scan the /dev directory for any hidden files used by malware, scan network interfaces in promiscuous mode, and check Rootkits using rootkit signatures database.
CDB lists and threat intelligence
Through employing the CDB list, which contains list of known malware threat indicators, Wazuh can detect the presence of malicious file if its signature is found in the list. This works well with FIM that scans for any changes in the path, files, or directories.
VirusTotal integration
Once integrated with VirusTotal, Wazuh can detect malicious files. Alerts are triggered when FIM detects any changes in the monitored folders, which then causes the VirusTotal integration to extract the hash value of the file. The hash is then compared to the VirusTotal database using the VirusTotal API. A response is then received that may trigger an alert that may contain an error or an indicative of the presence of a malicious file.
File integrity monitoring and YARA
YARA is a tool for identifying malware and malicious files by matching patterns and rules. When combined with FIM, files that cause alerts would start a YARA scan on the files and test it against its rules to identify whether they are malware or not. The scan results will be forwarded to the manager for decoding, analysis, and alerting. Decoders need to be added to the server so that these scans can be decoded.
ClamAV logs collection
ClamAV is an open-source anti-virus toolkit built to detect and combat malwares. It can be configured to collect logs from Linux and Windows endpoints.
Windows Defender logs collection
Agents on Windows endpoints can be configured to collect Windows Defender logs, that contain the status of the service and scan results on the endpoints.
Custom rules to detect malware IOC
This capability allows custom ruleset to be built to detect new variants of malware that come with new patterns of behaviour and Indicators of Compromise.
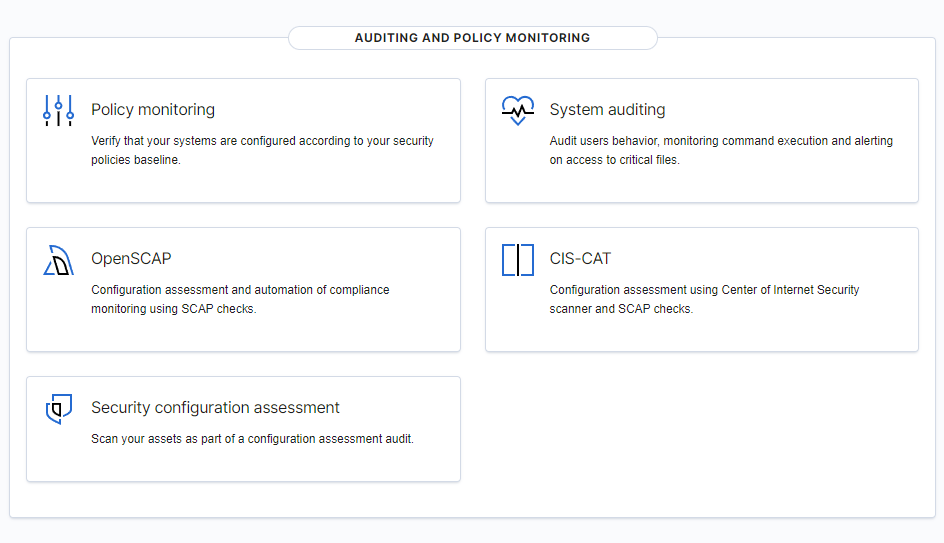
Security Configuration Assessment
Hardening is a process of securing endpoints by reducing their vulnerability surface area. Security Configuration Assessment (SCA) does that by confirming if the system abides by the predetermined configuration settings and approved application usage. The SCA module conducts scans to identify any misconfiguration and weaknesses on an endpoint and recommend remedies, e.g., change password-related configuration, delete unnecessary software, disable unnecessary services, or audit the TCP/IP stack configuration.
Active response
This capability aid incident responders address high severity events efficiently by triggering automatic responses based on specific triggers. The benefits of Active response include: providing real-time visibility into security events, reducing alert fatigue, automating response actions to threats, providing out-of-the-box response scripts.
Wazuh has default active response scripts for various types of endpoints that may trigger a specific action based on the configuration settings. It may disable a user account, adds and IP address to the iptables deny list, adds and IP address to the firewall drop list, or restart the Wazuh agent or manager. These are only a few of the active response included in Wazuh’s default script.
A custom active response script can also be created that gets executed when an alert for a specific rule ID, or a specific rule group is triggered. Any programming language may be used to create a custom script.
Log data collection
Log data collection is the process of continuously gathering and analyzing log records from servers, devices, and other sources in real-time through text files or Windows event logs. It can also directly take in remote syslogs from firewalls and similar devices.
The objective is to spot problems or risks by reviewing these logs, such as finding application or system errors, misconfigurations , unauthorized access attempts, policy violations, or other security issues.
This log collection does not require much memory or CPU power on the Wazuh agent itself, since its main role is passing events to the manager rather than analyzing them. But on the Wazuh manager server, CPU and memory usage can climb quickly depending on the volume of events per second that the manager must parse and examine. A high rate of incoming events for analysis places more demand on the manager’s resources.
Vulnerability detection
vulnerabilities, if not remediated will be exploited by malicious actors to gain unauthorized entry to a system. Wazuh’s Vulnerability Detector module helps users detect vulnerabilities in the operating system and applications installed on the monitored endpoints. It works by leveraging Wazuh’s built-in capacity to integrate with external sources of vulnerability data. These sources maintain databases of known vulnerabilities present in various software and operating systems. These are indexed by Canonical, Debian, Red Hat, Arch Linux, Amazon Linux Advisories Security (ALAS), Microsoft, and the National Vulnerability Database or NVD. With these sources, the server creates a global vulnerability database which it uses to cross-correlate with the application inventory data of the agent.
When a package is labeled as vulnerable, an alert will display the findings of the vulnerability, while the module will store it. The inventory of the vulnerabilities can be queried for alerts and vulnerability information.
Command monitoring
Command monitoring enables users to monitor the output of specific commands that may not be in the logs. For this capability to work, the wazuh agent must be configured to accept remote commands from the manager, configure command/s to monitor, which should ideally be configured on the manager. Lastly, the output needs to be processed to trigger an alert when the criteria are met.
Container security
Container platforms, like Docker, are secured and protected through centralized logging, rel-time monitoring, vulnerability scanning, and incident response automation, ensuring the availability of the containers and the applications they contain.
System inventory
This contains information about the hardware and software assets within an IT environment which is displayed in the dashboard. Alternatively, the database can be queried using the Wazuh API of the SQLite tool. The Vulnerability Detector module, which was previously covered, uses the vulnerability database to cross-correlate and identify vulnerabilities and patched software in the system. It is then crucial to keep an up-to-date inventory of a system.
Monitoring system calls
System call is a method of a program requesting a service from the kernel of the operating system. Monitoring these events can help security teams to study patterns of suspicious behavior and investigate potential security incidents on time. The Linux Audit system is used by Wazuh to store system call events then forward them to the server for further analysis. Only events related to security monitoring are captured, with Wazuh providing built-in rules for the detection of system calls. Alternatively, custom rules can be created depending on the requirements or compliance standards.
Agentless monitoring
This type of monitoring does not require installing an agent in an endpoint due to the nature of these devices. The work-around for this restriction is the use of SSH protocol to access and gather information from the endpoint. The endpoints supported are routers, firewalls, switches, and Linux/BSD systems.
Osquery
Osquery is an open-source agent built by Facebook in 2014 which converts the operating system of an endpoint into a relational database where SQL queries can be used to explore the device, such as its running processes, etc.
Monitoring security policies
This capability ensures that all monitored endpoints comply with the predefined rules on configuration settings and approved application usage.
Rootcheck, OpenSCAP, and CIS-CAT are the three components in this feature.
Rootcheck
Configurations files are checked to ensure compliance with security policies, standards, or hardening guides. Three checks are performed: if a process is running, if a file is present, and if a content contains a pattern of if a Windows registry key contains a string or is simply present.
OpenSCAP
OpeSCAP wodle is an integration of OpenSCAP with Wazuh HIDS, providing the ability to configure and conduct vulnerability scans of an agent. It has three primary uses: Verifying security compliance, Performing vulnerability assessments, and Performing specialized assessments
CIS-CAT integration
This component was developed to integrate CIS benchmark assessments into Wazuh agents. Cyber for Internet Security (CIS) is dedicated in protecting organizations from cyber threats by handing out benchmark guidelines.
Conclusion
In this first part of my Wazuh series, I took an introductory look at this powerful open source security monitoring platform. I covered the core components that make up a Wazuh deployment, including the server, indexer, dashboard, and agent. I also provided an overview of some of Wazuh’s extensive capabilities like file integrity monitoring, log analysis, vulnerability detection, and regulatory compliance. Key takeaways for me include the active-response, integration with several security platforms, and file integrity monitoring.
In the next post, I’ll dive hands-on into getting Wazuh up and running on my own system. I’ll walk through installing the core components on Ubuntu, configuring the server settings, and taking a test drive of the management dashboard. I’m looking forward to getting Wazuh fully deployed so I can start experimenting with its monitoring and protection capabilities!
Thanks for reading 🙂
Happy learning! Until next time!

Leave a comment