
Introduction
In my last post, I walked through practical examples of Wazuh capabilities including monitoring Docker events, NIDS integration, and malware detection using Yara and VirusTotal Integration. Now I’ll explore additional key features of the Wazuh agent including monitoring system calls, Security Configuration Assessment, taking active response, maintaining a system inventory, and leveraging osquery.
System call analysis reveals suspicious Linux process activity. Assessing configurations validates security policies are met. Active response automates incident containment. Inventory tracks assets and software. And osquery enables SQL querying of system data. These critical capabilities work continuously to secure endpoints.
Monitoring System Calls
Introduction
System calls are requests made by programs to the kernel to perform key operations. Monitoring these calls provides deep visibility into Linux process activity. This section demonstrates how Wazuh analyzes system calls to detect malicious command execution, suspicious file access, commands run as root, and privilege abuse.
Configuration
The Linux Audit system generates events for various activities such as write, read, execute, attribute change, or system call rules. Wazuh uses the “key” argument in audit rules to identify the specific rule that generated a particular audit log entry. A CDB list is used to determine the types of audit rules fired. Following is the syntax of the list:
<KEY_NAME>:<VALUE>where:
<KEY_NAME>is the string you used in the argument -k of a file system or system call rule.<VALUE>is one of the following values:- write: File system rules with
-p w. - read: File system rules with
-p r. - execute: File system rules with
-p x. - attribute: File system rules with
-p a. - command: System call rules.
- write: File system rules with
Configuring the Wazuh server
Wazuh comes with a pre-configured audit CDB list that consists of audit keys that correspond to various events such as write, read, attribute change, execution, and command events.
Run the command below to view the content of the CDB list:
cat /var/ossec/etc/lists/audit-keys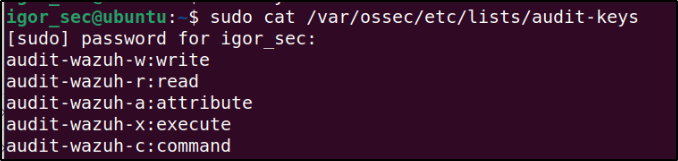
Output:
audit-wazuh-w:write audit-wazuh-r:read audit-wazuh-a:attribute audit-wazuh-x:execute audit-wazuh-c:commandAdd custom key with its value to the list like this:
echo "<YOUR_KEY>:<VALUE>" >> /var/ossec/etc/lists/audit-keysWhere <YOUR_KEY> is the key set in the audit rule and <VALUE> is used by Wazuh to process the event.
echo "audit-wazuh-w:write" >> /var/ossec/etc/lists/audit-keys
echo "audit-wazuh-r:read" >> /var/ossec/etc/lists/audit-keys
echo "audit-wazuh-a:attribute" >> /var/ossec/etc/lists/audit-keys
echo "audit-wazuh-x:execute" >> /var/ossec/etc/lists/audit-keys
echo "audit-wazuh-c:command" >> /var/ossec/etc/lists/audit-keys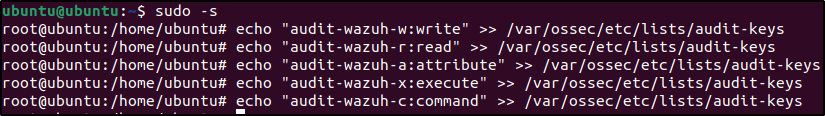
Restart the Wazuh manager any time the CDB list is modified:
systemctl restart wazuh-managerOut-of-the-box rules for Audit events are located in the /var/ossec/ruleset/rules/0365-auditd_rules.xml file on the Wazuh server.
Configuring the Ubuntu endpoint
1. To utilize the Linux Audit system, it is necessary to install the audit package on the endpoint. Execute the following command as the root user to install the package:
sudo apt -y install auditd
sudo systemctl start auditd
sudo systemctl enable auditd
2. To integrate the events detected by the Linux Audit system with Wazuh, edit the Wazuh agent’s configuration file located at /var/ossec/etc/ossec.conf. By adding the following configuration, Wazuh is able to read the audit file log to process the audit system detects:
<localfile>
  <log_format>audit</log_format>
  <location>/var/log/audit/audit.log</location>
</localfile>
3. Restart the Wazuh agent to apply the changes:
systemctl restart wazuh-agent4. Create proper audit rules using the auditctl command or the audit rules file.
Linux audit alerts are displayed in the Security Events and System Auditing tab of the Wazuh dashboard.
Monitoring execution of malicious commands
In this scenario, I set up Auditd on an Ubuntu device to track and log all commands executed by a specific user, even those performed with elevated privileges or as the root user. Additionally, a personalized Wazuh rule can be created to receive notifications for any potentially suspicious commands detected.
Consider reading the Monitoring system calls section to get a broader picture of the ways to take advantage of it.
Configuring the Ubuntu endpoint
Follow these steps to generate the required audit rules for querying all commands executed by a user with privileged access. The Wazuh CDB list lookup functionality is then used to generate a compilation of potentially harmful commands that can be executed on it.
1. As the root user, execute the following commands to append audit rules to /etc/audit/audit.rules file:
echo "-a exit,always -F auid=1000 -F egid!=994 -F auid!=-1 -F arch=b32 -S execve -k audit-wazuh-c" >> /etc/audit/audit.rules
echo "-a exit,always -F auid=1000 -F egid!=994 -F auid!=-1 -F arch=b64 -S execve -k audit-wazuh-c" >> /etc/audit/audit.rules
2. Reload the rules and confirm that they are in place:
sudo auditctl -R /etc/audit/audit.rules
sudo auditctl -l
Output:
-a always,exit -F arch=b32 -S execve -F auid=1000 -F egid!=994 -F auid!=-1 -F key=audit-wazuh-c -a always,exit -F arch=b64 -S execve -F auid=1000 -F egid!=994 -F auid!=-1 -F key=audit-wazuh-c
4. Add the following configuration to the Wazuh agent /var/ossec/etc/ossec.conf file. This allows the Wazuh agent to read the auditd logs file:
<localfile>
  <log_format>audit</log_format>
  <location>/var/log/audit/audit.log</location>
</localfile>
I also added this configuration in the Wazuh server configuration settings.

4. Restart the Wazuh agent
Configuring the Wazuh server
Follow these steps in order to create a CDB (Concurrent Data Base) list of malicious programs as well as rules for detecting the execution of those programs.
1. Look over the key-value pairs in the lookup file /var/ossec/etc/lists/audit-keys.
audit-wazuh-w:write
audit-wazuh-r:read
audit-wazuh-a:attribute
audit-wazuh-x:execute
audit-wazuh-c:command
This CDB list contains keys and values separated by colons.
Note: Wazuh allows flat file CDB lists to be used, which can contain just a key or key-value pairs. These lists are optimized for quick lookups in Wazuh rules. The lists need to be created as files, added to the Wazuh configuration, and then compiled. Once compiled, create rules that match decoded fields with the values in these CDB lists. For instance, there is a text file called /var/ossec/etc/lists/audit-keys that corresponds to a binary file /var/ossec/etc/lists/audit-keys.cdb, which Wazuh utilizes for efficient lookups.
2. Create a CDB list /var/ossec/etc/lists/suspicious-programs and fill its content with the following:
ncat:yellow
nc:red
tcpdump:orange
3. Add the list to the <ruleset> section of the Wazuh server /var/ossec/etc/ossec.conf file:
<list>etc/lists/suspicious-programs</list>
4. Create a high severity rule to fire when a “red” program is executed. Add this new rule to the /var/ossec/etc/rules/local_rules.xml file on the Wazuh server.
<group name="audit">
  <rule id="100210" level="12">
      <if_sid>80792</if_sid>
  <list field="audit.command" lookup="match_key_value" check_value="red">etc/lists/suspicious-programs</list>
    <description>Audit: Highly Suspicious Command executed: $(audit.exe)</description>
      <group>audit_command,</group>
  </rule>
</group>
5. Restart the Wazuh manager:
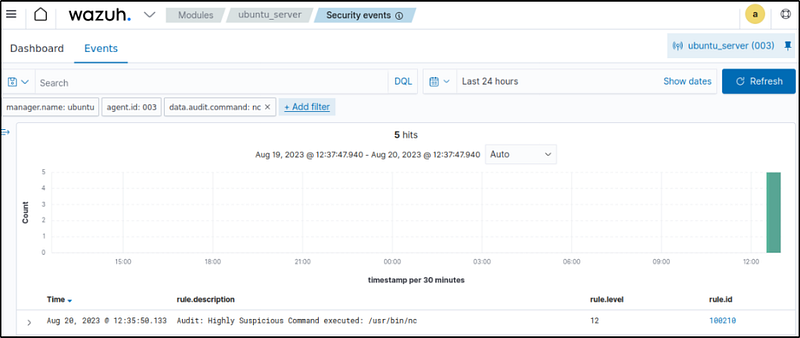
Attack emulation
On the Ubuntu endpoint, install and run a “red” program netcat:
sudo apt -y install netcat

nc -l 5555
Visualize the alerts
Filter the events with:
data.audit.command:nc

Monitoring file and directory access
In this example, I monitor various types of access to the /home directory of the monitored endpoint. This includes write, read, execution access, and changes in the directory’s attributes.
Configuring the Ubuntu endpoint
1. Run the commands below to configure the following audit rules:
echo "-w /home -p w -k audit-wazuh-w" >> /etc/audit/audit.rules
echo "-w /home -p a -k audit-wazuh-a" >> /etc/audit/audit.rules
echo "-w /home -p r -k audit-wazuh-r" >> /etc/audit/audit.rules
echo "-w /home -p x -k audit-wazuh-x" >> /etc/audit/audit.rules
2. Reload the audit rules to apply the changes:
auditctl -R /etc/audit/audit.rules
auditctl -l
Output:
-w /home -p w -k audit-wazuh-w -w /home -p a -k audit-wazuh-a -w /home -p r -k audit-wazuh-r -w /home -p x -k audit-wazuh-xAudit configuration alerts are displayed in the Security Events and System Auditing tab of the Wazuh dashboard.
Note: Although it is technically feasible to combine the previous audit rules into a single rule using the -p warx parameter, they are deliberately separated. This separation allows each rule to have its own distinct key value which is crucial for analysis.
Test the configuration
Perform the following actions on the Ubuntu endpoint.
Create a new file
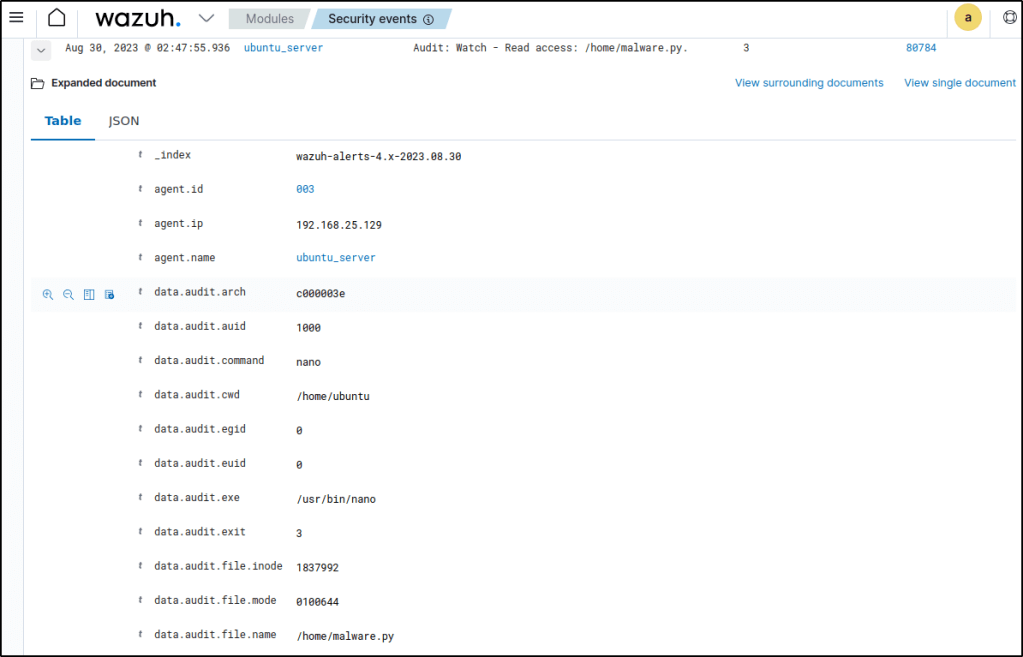
Run the command below to create a new file in the /home directory:
sudo touch /home/malware.py
Apply rule.id:80790 to filter to query the alert.


Write access
Run the command below to read the new file:
sudo nano /home/malware.pyFilter the events with rule.id:80784.

Change permissions
Run the command below to change the permission of the /home/malware.py file:
sudo chmod u+x /home/malware.pyUse the filter rule.id:80787 to retrieve the relevant alert.


Read and execute access
Run the command below to execute the /home/malware.py file:
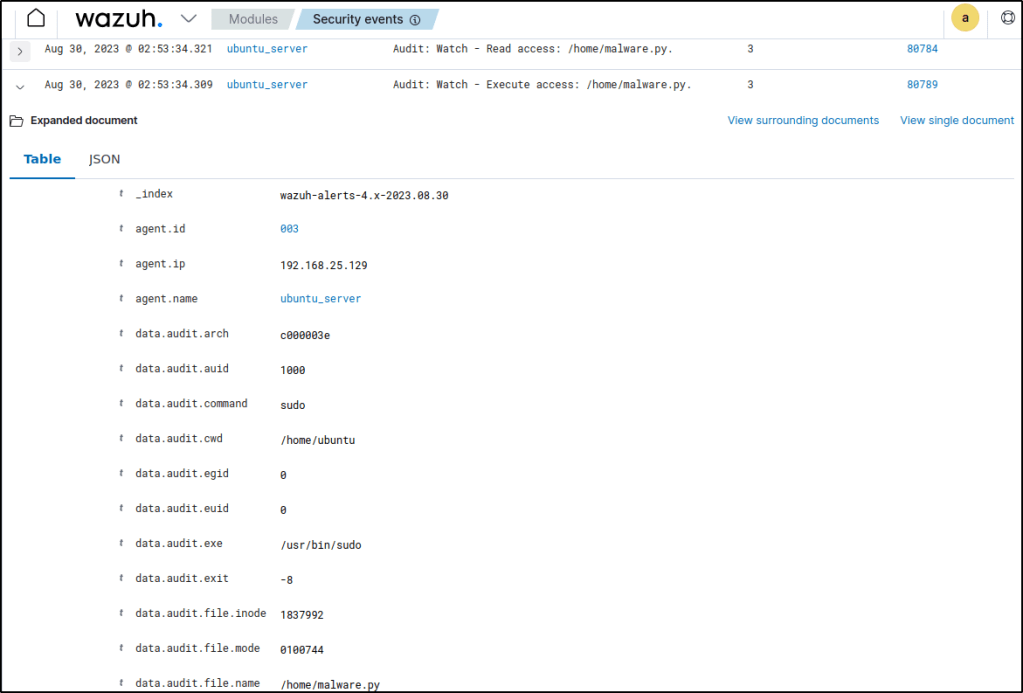
sudo /home/malware.pyGo to the Security events module and apply the rule.id: (80784 OR 80789) filters to query the alerts.

Delete file
Run the command below to delete the /home/malware.py file:
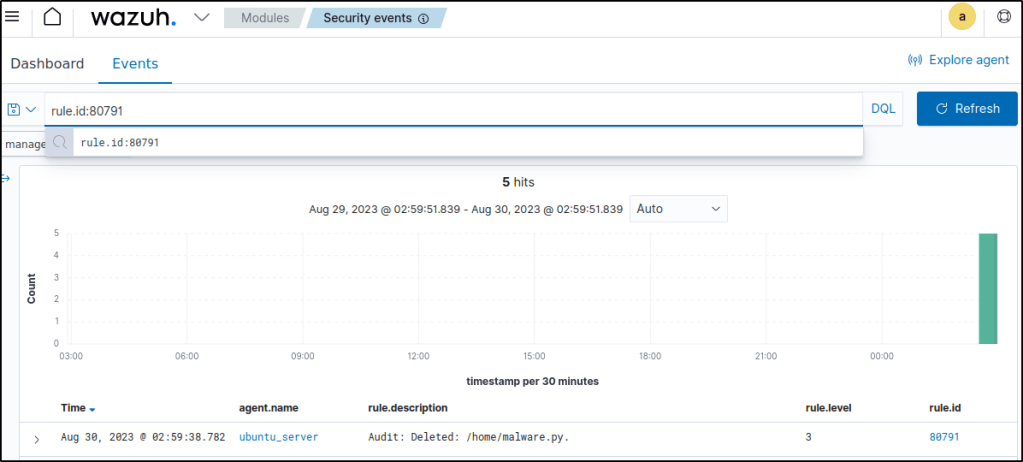
sudo rm /home/malware.pyApply the rule.id:80791 filter to query the alert.

Monitoring commands run as root
This sub-section demonstrates how Wazuh monitors all commands executed with root privileges with Audit system.
Configuring the Ubuntu endpoint
1. Add the rules below in the /etc/audit/audit.rules audit rule file:
echo "-a exit,always -F euid=0 -F arch=b64 -S execve -k audit-wazuh-c" >> /etc/audit/audit.rules
echo "-a exit,always -F euid=0 -F arch=b32 -S execve -k audit-wazuh-c" >> /etc/audit/audit.rules
-a always,exit: Specifies that the audit event should always be generated, regardless of whether the system call was successful or not.-S execve: Specifies that the rule should match events that involve theexecvesystem call.-F euid=0: Specifies that the rule should only match events where the effective user ID (euid) is equal to 0, which is the root user.-k audit-wazuh-c: Specifies a key value that will be used to tag the generated audit events.
Overall, this rule generates audit events for every execution of the execve system call by the root user (euid=0) and tags those events with the key "audit-wazuh-c".
2. Reload the audit rules to apply the changes:
auditctl -R /etc/audit/audit.rules
auditctl -l
Output:
-w /home -p w -k audit-wazuh-w
-w /home -p a -k audit-wazuh-a
-w /home -p r -k audit-wazuh-r
-w /home -p x -k audit-wazuh-x
-a always,exit -F arch=b64 -S execve -F euid=0 -F key=audit-wazuh-c
-a always,exit -F arch=b32 -S execve -F euid=0 -F key=audit-wazuh-c
Test the configuration
Perform the following actions below.
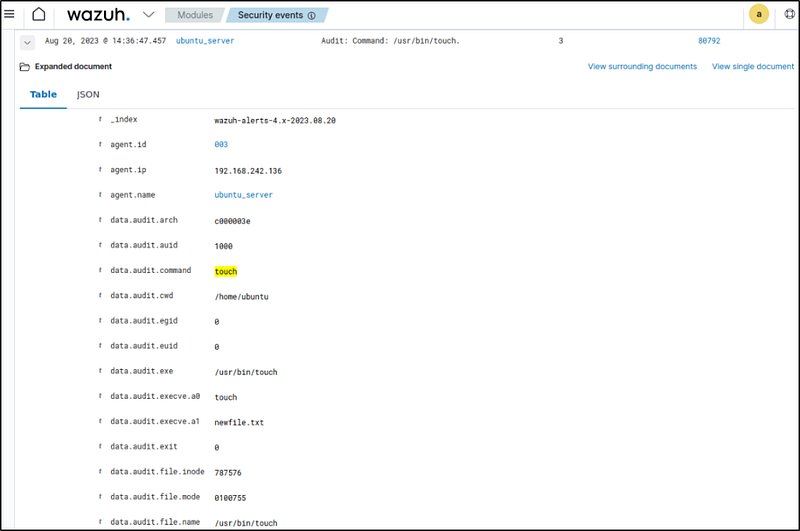
1. Run the following command as a regular user using root privileges:
sudo touch newfile.txt2. Run the command below as the root user:
touch newfile2.txt
Events are filtered with rule.id:80792 in the Wazuh dashboard.
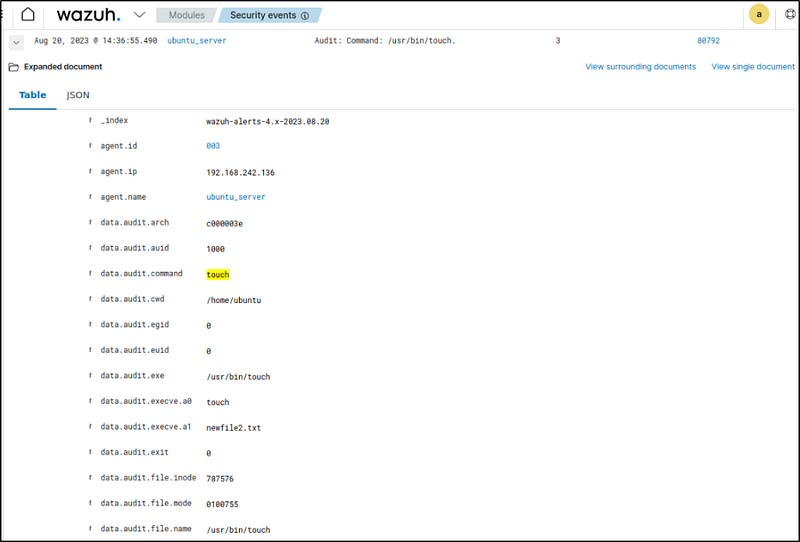
The euid field was examined and was able to determine that both actions were carried out with root privileges. To delve deeper, the initiator of the action can be identified by reviewing the auid field.
Privilege abuse
This scenario illustrates how Wazuh can effectively monitor the access to confidential information in users’ personal folders. It involves the utilization of an audit rule that constantly observes all files and subdirectories within a user’s home directory, detecting any unauthorized attempts to access them. By implementing a custom rule in Wazuh, any suspicious activity is promptly flagged, enabling security teams to promptly respond and mitigate potential risks.
Configuring the Ubuntu endpoint
In this scenario, there are two individuals named John and Jane. Jane’s home directory is under constant surveillance to detect any unauthorized attempts by users other than Jane or the root user to access this directory.
1. Create the two users, Jane and John, on the Ubuntu endpoint:
useradd jane
useradd john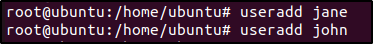
2. Edit the audit rule file /etc/audit/audit.rules and add the following configuration:
echo "-a always,exit -S open -S openat -F dir=/home/jane/ -F perm=rwa -F auid>=1000 -F auid!=-1 -F euid!=<EUID_OF_JANE> -F uid!=0 -C auid!=obj_uid -F key=power_abuse">>/etc/audit/audit.rulesHere is a breakdown of the rule:
-a always,exitspecifies that the rule should always trigger on a process exit.-F dir=/home/jane/specifies that the rule should only apply to files and directories inside the/home/janedirectory.-F perm=rwaspecifies the permissions being monitored for the system call to occur, in this case, read, write, and append permissions.-F auid>=1000this specifies the audit UID (auid), which is the user ID associated with the process that triggered the event, should be more than or equal to 1000.-F auid!=-1specifies theauidshould not be equal to -1, which is used when a process is launched without a user ID.-F euid!=<EUID_OF_JANE>specifies that the audit rule should not apply to Jane herself.<EUID_OF_JANE>represents Jane’seuid. You can obtain a usereuidusing the following command:
id -u jane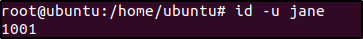
-F uid!=0specifies that the audit rule doesn’t apply to the root user.-C auid!=obj_uidspecifies that theauidshould not be equal to the object UID (obj_uid), which is the UID associated with the accessed file or directory.-k power_abuseprovides a unique ID that Wazuh uses to analyze the audit logs.
This audit rule logs all attempts by another user to open files or directories inside Jane’s home directory.
3. Reload the rules and confirm they are in place:
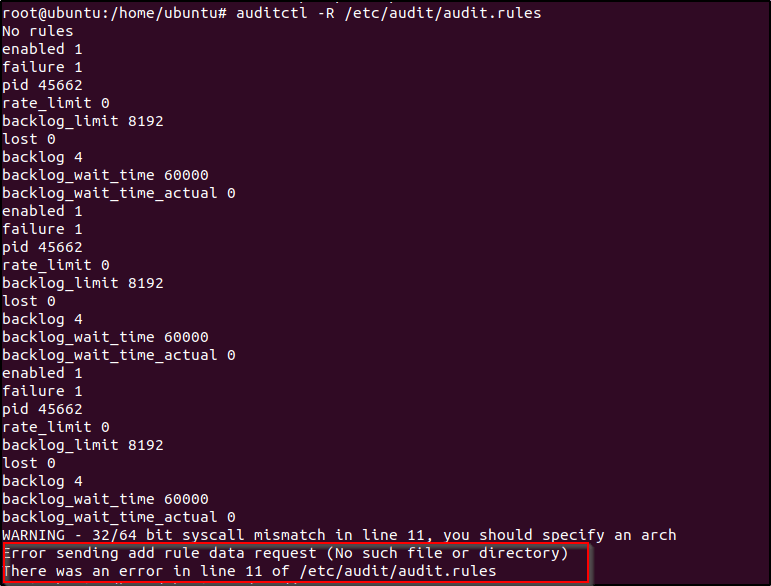
auditctl -R /etc/audit/audit.rules

auditctl -l
Output:
-a always,exit -S open,openat -F dir=/home/jane/ -F perm=rwa -F auid>=1000 -F auid!=-1 -F euid!=1003 -F uid!=0 -C auid!=obj_uid -F key=power_abuseThere was an error as seen in the image, no file or directory found.
I added a home directory and changed ownership to jane.
mkdir /home/jane
chown jane:jane /home/jane
The rule is now confirmed if I reload the rules once more.

Configuring the Wazuh server
1. Update the /var/ossec/etc/lists/audit-keys CDB list with the custom audit key:
echo "power_abuse:abuse" >> /var/ossec/etc/lists/audit-keys
2. Add the following rule to the custom
<group name="audit">
<rule id="100210" level="8">
<if_sid>80700</if_sid>
<list field="audit.key" lookup="match_key_value" check_value="abuse">etc/lists/audit-keys</list>
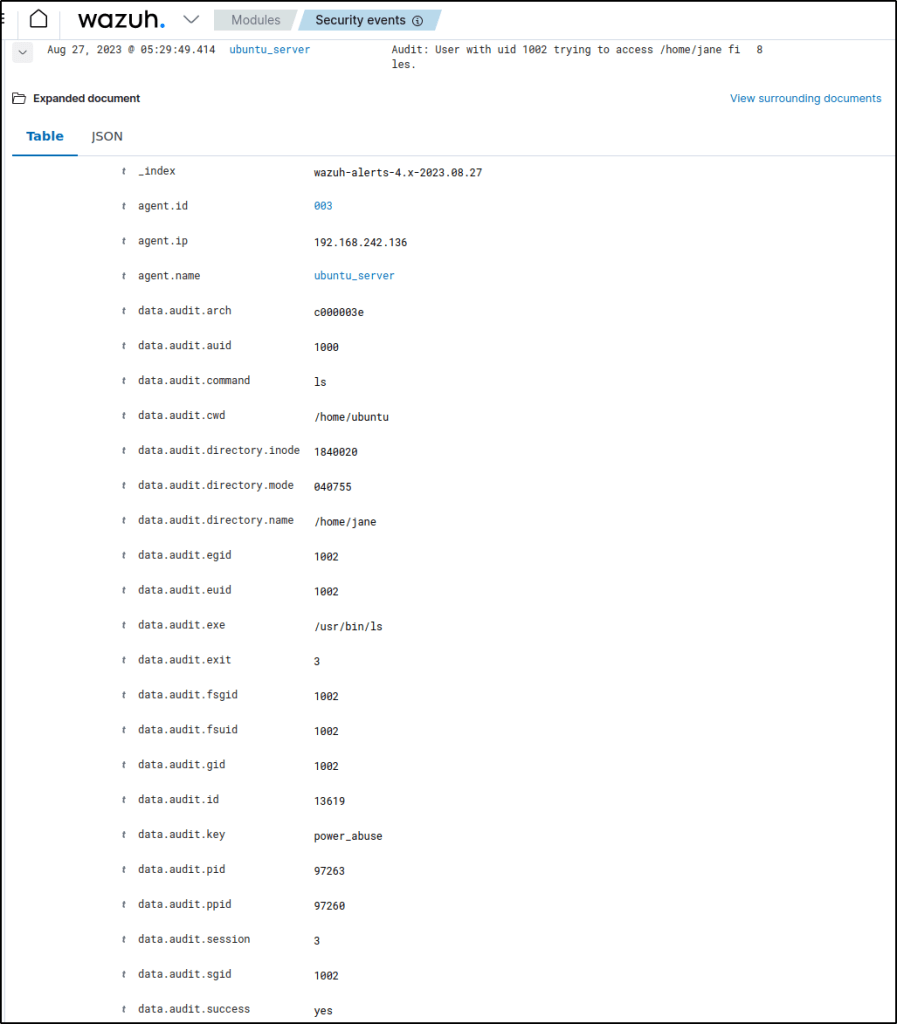
<description>Audit: User with uid $(audit.uid) trying to access $(audit.directory.name) files.</description>
<group>audit_command,</group>
</rule>
</group>
3. Restart the Wazuh manager to apply the changes:
Test the configuration
Carry out the following actions on the monitored endpoint to evaluate the configuration.
1. Switch to the user John:
su john2. Then, try to list the content of /home/jane or open any file under this directory:
ls /home/jane/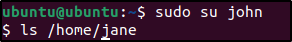
Visualize the alerts for rule.id:100210 in the Wazuh dashboard.

Conclusion
Analyzing system calls allows Wazuh to reveal malicious Linux process activity that typical monitoring would miss. By detecting execution of risky commands, access to sensitive files, root command use, and privilege escalation, Wazuh provides invaluable protection against threats and policy violations.
Security Configuration Assessment
Introduction
Validating configuration settings and resources against security best practices is crucial. This portion demonstrates how Wazuh conducts assessments to check for misconfigurations and enforce policies by detecting keywords in files or running processes.
How to share policy files and configuration with the Wazuh agents
The Wazuh manager has the ability to distribute files and configurations to Wazuh agents that are connected, as stated in the centralized configuration section of the documentation.
This feature can be enabled to push policy files to the Wazuh agents in defined groups. By default, every Wazuh agent belongs to the default group, which is used here as an example:
1. On the Wazuh agent, edit the local_internal_options.conf file to allow the execution of commands in SCA policies sent from the Wazuh server:
echo "sca.remote_commands=1" >> /var/ossec/etc/local_internal_options.confNote:By enabling remote command execution, the Wazuh server gains the ability to execute commands on the monitored endpoint. Remote commands are disabled by default as a security measure, which helps reduce the attack surface in case the Wazuh server is compromised.
Enabling the remote commands is not requried if the policy files are added to each agent without using the Wazuh server to push them. For example, policy file can be manually created directly on the monitored endpoint, or use scp to copy the policy file to the monitored endpoint.
2. On the Wazuh server, place a new policy file in the /var/ossec/etc/shared/default folder and change its ownership. Replace <NEW_POLICY_FILE> with a policy name.
chown wazuh:wazuh /var/ossec/etc/shared/default/<NEW_POLICY_FILE>3. Add the following configuration block to the Wazuh server /var/ossec/etc/shared/default/agent.conf file to configure the new policy file in the Wazuh agent:
<agent_config>
  <!-- Shared agent configuration here -->
  <sca>
    <policies>
        <policy>etc/shared/<NEW_POLICY_FILE></policy>
    </policies>
  </sca>
</agent_config>
The new <sca> block in the Wazuh server /var/ossec/etc/shared/default/agent.conf file is merged with the <sca> block on the Wazuh agent side, and the new configuration is added.
Available SCA policies
Below is a list of SCA policies already included in Wazuh by default. The Wazuh agent will install the appropriate policy file based on the operating system of the endpoint.
Available SCA policies for my Ubuntu endpoint.
| Policy | Name | Target |
|---|---|---|
| cis_ubuntu22-04 | CIS Checks for Ubuntu Linux 22.04 LTS | Ubuntu 22.04 |

Use cases
This section shows some custom SCA use cases for various operating systems.
The use cases covered in this section include Detecting keyword in a file and Detecting a running process.
Detecting keyword in a file
In this use case, I configured the Wazuh SCA to detect the presence of a keyword in the file testfile.txt for the phrase password_enabled: yes. The Wazuh SCA module triggers an alert when it detects the pattern in the file.
Configuring the Ubuntu endpoint
Following are the instructions to create a file named testfile.txt on the Ubuntu device and monitor it using the Wazuh SCA module:
1. Create the test file and add some text to it, including the phrase password_enabled: yes:
echo -e "config_file\nsecond line of configuration\npassword_enabled: yes" > /usr/share/testfile.txt2. Verify that the file has been created:
cat /usr/share/testfile.txt
Output:
config_file
second line of configuration
password_enabled: yes
3. Create a new directory to save the custom policy files:
mkdir /var/ossec/etc/custom-sca-files/
4. Create a new SCA policy file /var/ossec/etc/custom-sca-files/keywordcheck.yml and add the following content to it:
policy:
  id: "keyword_check"
  file: "keywordcheck.yml"
  name: "SCA use case: Keyword check"
  description: "Guidance for checking for a keyword or phrase in files on Ubuntu endpoints."
  references:
    - https://documentation.wazuh.com/current/user-manual/capabilities/sec-config-assessment/index.html
    - https://documentation.wazuh.com/current/user-manual/capabilities/sec-config-assessment/creating-custom-policies.html

requirements:
  title: "Check that the desired file exists on the monitored endpoints"
  description: "Requirements for running the SCA scans against endpoints with testfile.txt on them."
  condition: any
  rules:
    - 'f:/usr/share/testfile.txt'

checks:
  - id: 10000
    title: "Ensure password is disabled in the test configuration file"
    description: "Password is enabled in the test configuration file."
    rationale: "Password is considered weak for the custom test application. Threat actors can brute-force your password."
    remediation: "Disable password by setting the value of the password_enabled option to no."
    condition: none
    rules:
      - 'f:/usr/share/testfile.txt -> r:^password_enabled: yes$'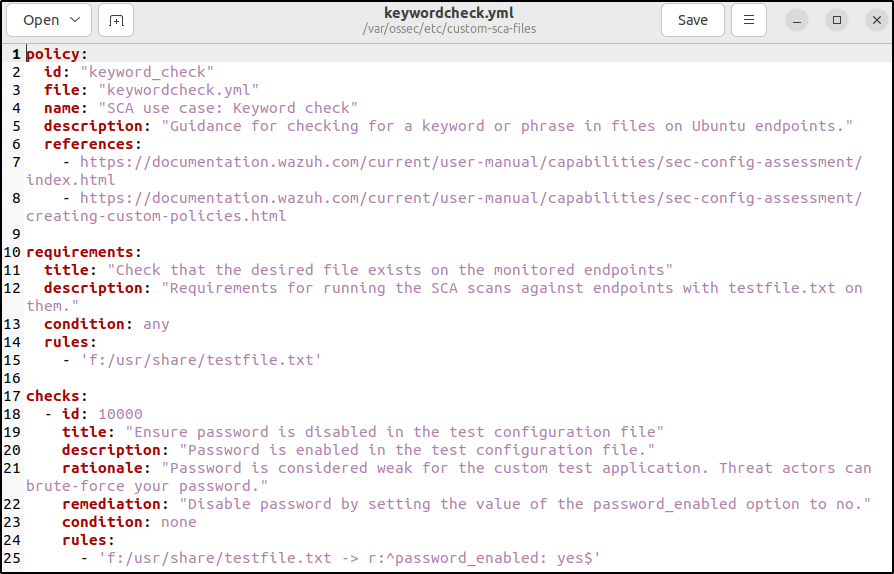
- This created a requirement to ensure that the policy runs only if the file
/usr/share/testfile.txtexists on the endpoint. - Check ID
10000scans the file/usr/share/testfile.txtto find any line that contains the stringpassword_enabled: yes. Thenonecondition ensures that the check fails if a match is found.
5. Change the ownership of the file so Wazuh has permission to it:
chown wazuh:wazuh /var/ossec/etc/custom-sca-files/keywordcheck.yml
6. Enable the policy file by adding the following lines to the <ossec_config> block of the Wazuh agent configuration file at /var/ossec/etc/ossec.conf:
<sca>
  <policies>
    <policy enabled="yes">/var/ossec/etc/custom-sca-files/keywordcheck.yml</policy>
  </policies>
</sca>
7. Restart the Wazuh agent to apply the changes and to run the new SCA check:
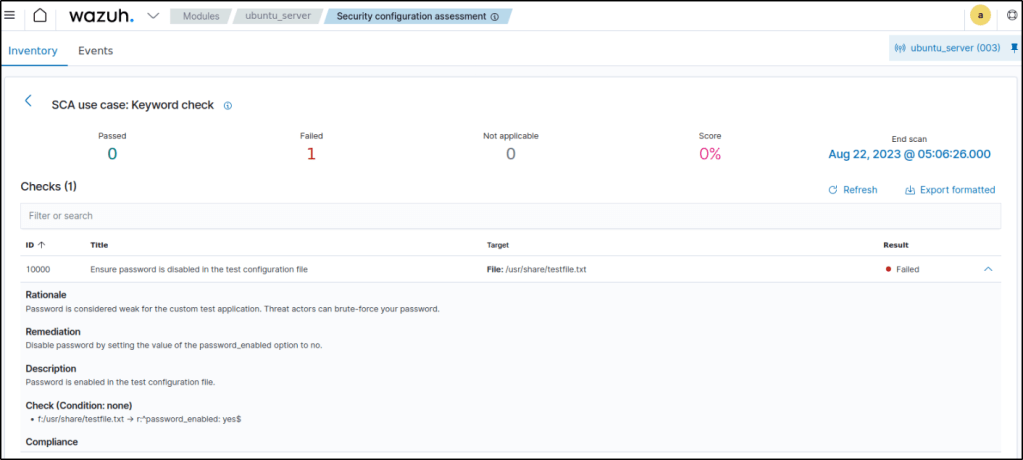
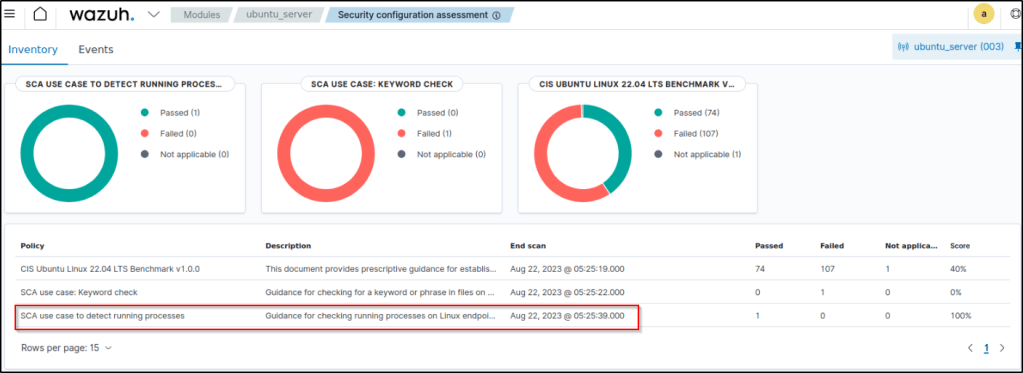
8. On the Wazuh dashboard, navigate to the SCA tab and select the Ubuntu endpoint to view the results of the custom SCA check that was created.

Detecting a running process
This sub-section presents how to detect running processes with the Wazuh SCA module.
Configuring the Ubuntu endpoint
Netcat is a tool that facilitates data transfer over IP networks using TCP and UDP protocols. It can establish connections, transmit data, and monitor specific ports. Unfortunately, threat actors use netcat for malicious activities, like creating hidden access points. To enhance security, Wazuh SCA module is configured to detect and prevent netcat processes, thereby safeguarding against potential attacks.
1. Create a new directory to save custom policy files:
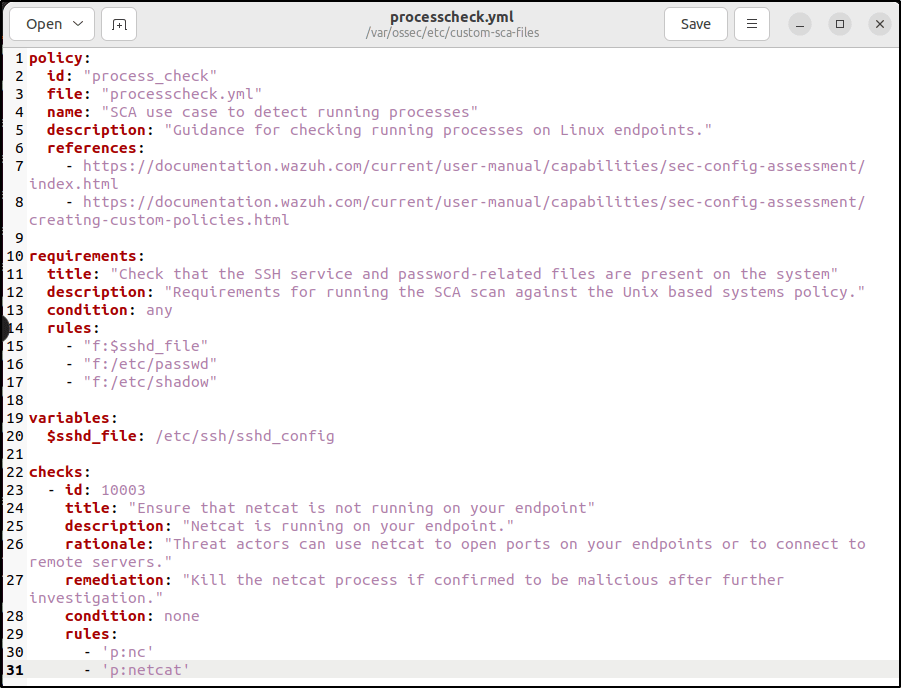
mkdir /var/ossec/etc/custom-sca-files/2. Create a new SCA policy file /var/ossec/etc/custom-sca-files/processcheck.yml and add the following content to it:
policy:
  id: "process_check"
  file: "processcheck.yml"
  name: "SCA use case to detect running processes"
  description: "Guidance for checking running processes on Linux endpoints."
  references:
    - https://documentation.wazuh.com/current/user-manual/capabilities/sec-config-assessment/index.html
    - https://documentation.wazuh.com/current/user-manual/capabilities/sec-config-assessment/creating-custom-policies.html

requirements:
  title: "Check that the SSH service and password-related files are present on the system"
  description: "Requirements for running the SCA scan against the Unix based systems policy."
  condition: any
  rules:
    - "f:$sshd_file"
    - "f:/etc/passwd"
    - "f:/etc/shadow"

variables:
  $sshd_file: /etc/ssh/sshd_config

checks:
  - id: 10003
    title: "Ensure that netcat is not running on your endpoint"
    description: "Netcat is running on your endpoint."
    rationale: "Threat actors can use netcat to open ports on your endpoints or to connect to remote servers."
    remediation: "Kill the netcat process if confirmed to be malicious after further investigation."
    condition: none
    rules:
      - 'p:nc'
- 'p:netcat'- A requirement is created to ensure that the policy runs only on Linux endpoints. The requirement checks for the presence of the
/etc/ssh/sshd_config,/etc/passwd, and/etc/shadowfiles, and passes if any of them is found. - Check ID
10003scans the endpoint for processes namedncornetcat. Thenonecondition ensures that the check fails if a match is found.
3. Change the ownership of the file so Wazuh has permission to it:
chown wazuh:wazuh /var/ossec/etc/custom-sca-files/processcheck.yml
4. Enable the policy file by adding the following lines to the <ossec_config> block of the Wazuh agent configuration file at /var/ossec/etc/ossec.conf:
<sca>
  <policies>
    <policy enabled="yes">/var/ossec/etc/custom-sca-files/processcheck.yml</policy>
  </policies>
</sca>
5. Install netcat if not yet installed:
apt install netcat6. Run netcat on a new terminal and let the listener run:
netcat -l 4444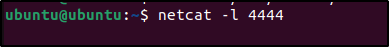
7. Restart the Wazuh agent to apply the changes and to run the new SCA check:
8. On the Wazuh dashboard, navigate to the SCA tab and select the Ubuntu endpoint to view the results of the custom SCA check that was created.

Conclusion
Wazuh configuration assessments provide continuous validation of desired settings and resources. By detecting insecure configurations like clear-text passwords and non-compliant applications, Wazuh strengthens policy enforcement and security posture.
Active response
Introduction
Wazuh can automate actions to contain threats through active response capabilities. I’ll explore more about active response by disabling a user account and restarting an agent when specific conditions are met.
Disabling a Linux user account with active response
An adversary may resort to systematically attempting various combinations in order to gain access to an account. To counteract this behavior, the “disable-account” active response can be implemented to disable a Linux/Unix account, with the user specified in the “dstuser” field of a Wazuh alert, that is under attack by brute force methods.
Configuring the Wazuh server
1. Add the rule below to the Wazuh server /var/ossec/etc/rules/local_rules.xml file:
<group name="pam,syslog,">
  <rule id="100100" level="10" frequency="3" timeframe="120">
    <if_matched_sid>5503</if_matched_sid>
    <description>Possible password guess on $(dstuser): 3 failed logins in a short period of time</description>
    <mitre>
      <id>T1110</id>
    </mitre>
  </rule>
</group>
This condition verifies if there have been three unsuccessful attempts to log in to the same user account within a span of two minutes.

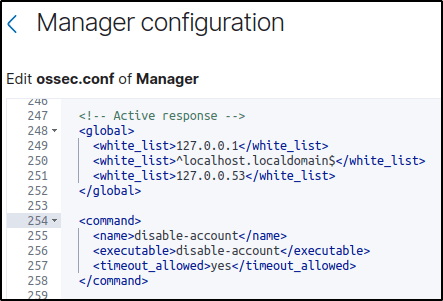
2. Open the Wazuh server /var/ossec/etc/ossec.conf file and verify that a <command> block called disable-account with the following configuration is present within the <ossec_config> block:
<command>
  <name>disable-account</name>
  <executable>disable-account</executable>
  <timeout_allowed>yes</timeout_allowed>
</command>
The <command> block contains information about the action to be executed on the Wazuh agent.
<name>: Sets a name for the command. In this case,disable-account.<executable>: Specifies the active response script that must run after a trigger. In this case, it’s thedisable-accountexecutable.<timeout_allowed>: Allows a timeout after a period of time. This tag is set toyeshere, which represents a stateful active response.
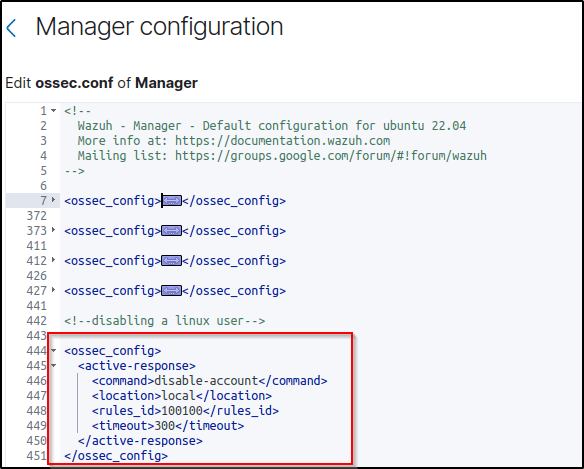
3. Add the <active-response> block below to the Wazuh server /var/ossec/etc/ossec.conf configuration file:
<ossec_config>
  <active-response>
    <command>disable-account</command>
    <location>local</location>
    <rules_id>100100</rules_id>
    <timeout>300</timeout>
  </active-response>
</ossec_config><command>: Specifies the command to configure. This is the command namedisable-accountdefined in the previous step.<location>: Specifies where the command executes. Using thelocalvalue here means that the command executes on the monitored endpoint where the trigger event occurs.<rules_id>: The active response module executes the command if rule ID100100:Possible password guess on $(dstuser): 3 failed logins in a short period of timefires.<timeout>: Specifies how long the active response action must last. In this use case, we configure it to last for 300 seconds. After that period, the active response reverts its action and re-enables the account.
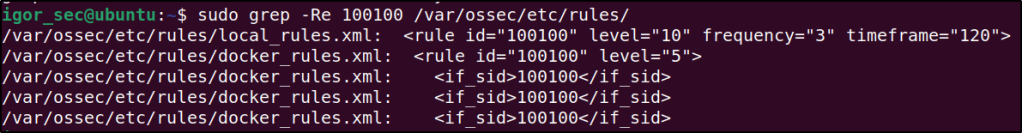
Problem encountered. I faced an issue where the active response did not get triggered after I made the configuration. To troubleshoot this, I checked the rules to see if there was a duplicate rule ID that could be causing the problem. Upon examining the image provided, it is evident that the rule ID 100100 is already being utilized in the docker_rules.xml file.
I attempted to modify the identification number to “100004” and verified its availability.

I have modified the rule ID in the local_rules.xml configuration file because it was not being used or already taken.
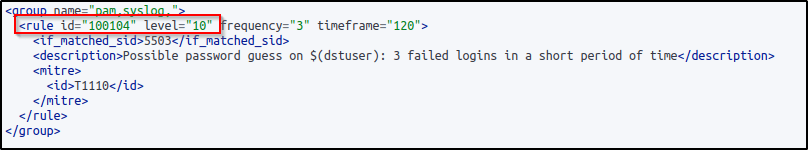
The server configuration was additionally modified to correspond with the same rule identification.

4. Restart the Wazuh manager service to apply changes:
Configuring the Ubuntu endpoint
1. Create two users for testing purposes:
sudo adduser user1
sudo adduser user2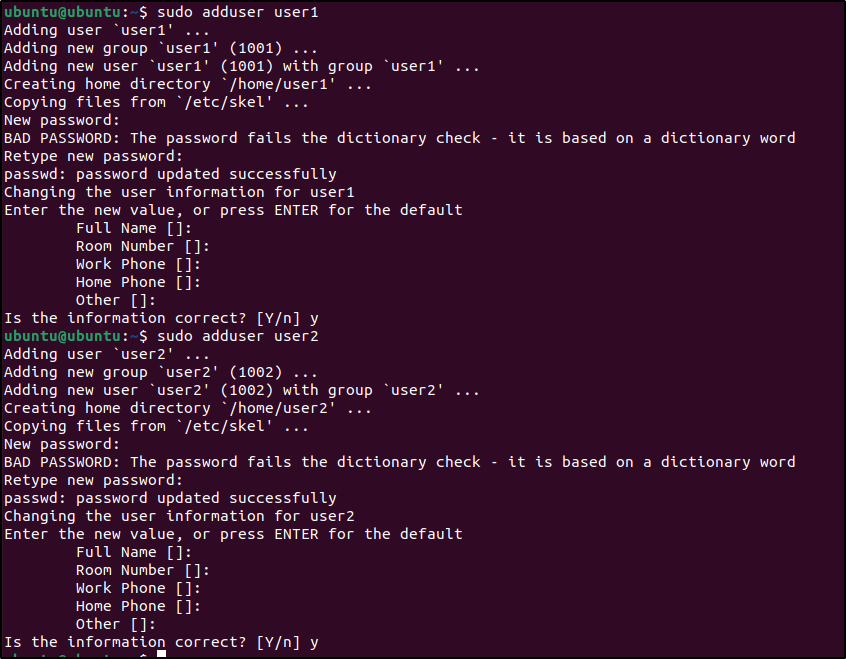
Test the configuration
To test the scenario, log in to the user1 account and try to switch to the user2 account by using an incorrect password. Then, verify that the user2 account is deactivated and observe the corresponding notifications on the Wazuh dashboard.
1. Switch to user1 using the correct password:
su user12. As user1, run the following commands three(3) times and type in any wrong password for user2 when prompted to enter the password:
su user2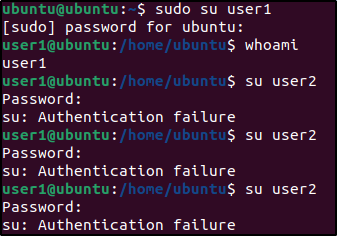
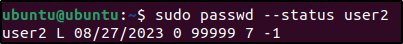
3. Check that the account was successfully locked using the passwd command:
sudo passwd --status user2 Output:
user2 L 02/20/2023 0 99999 7 -1 The L flag indicates the account is locked.
Visualize the alerts
The illustration displayed below represents the moment when the response becomes active, occurring right after rule ID 100100 is triggered, resulting in the deactivation of the account. However, the account is subsequently reactivated 5 minutes later.

The log from /var/ossec/logs/active-responses.log would also display the active-response being deployed.

After a duration of 5 minutes, the account is reactivated.


Restarting the Wazuh agent with active response
The “restart-wazuh” active response script is used to initiate a restart of the Wazuh agent on a monitored endpoint. This particular configuration allows for the automatic restart of the Wazuh agent whenever modifications are made to the “/var/ossec/etc/ossec.conf” configuration file.
Configuring the Wazuh server
1. Open the Wazuh server /var/ossec/etc/ossec.conf file and verify that a <command> block called restart-wazuh with the following configuration is present within the <ossec_config> block:
<command>
  <name>restart-wazuh</name>
  <executable>restart-wazuh</executable>
</command>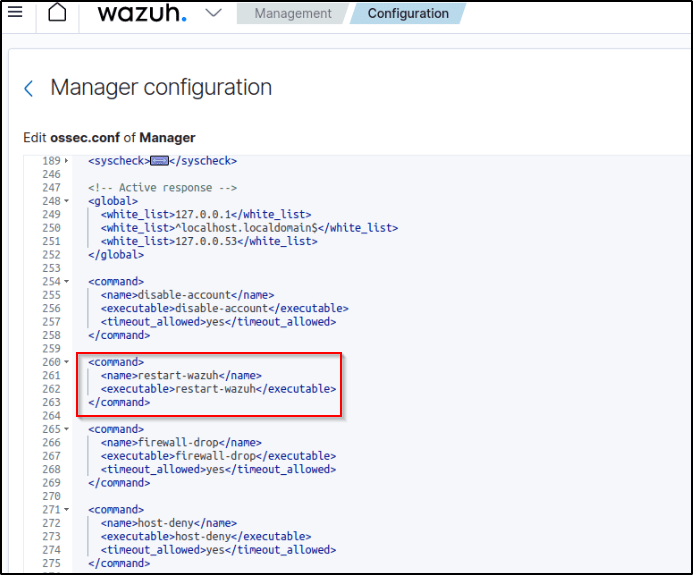
The <command> block contains information about the action to be executed on the Wazuh agent:
<name>: Sets a name for the command. In this case,restart-wazuh.<executable>: Specifies the active response script or executable that must run after a trigger. In this case, it’s therestart-wazuhexecutable.<timeout_allowed>: Allows a timeout after a period of time. This tag is set to no here, which represents a stateless active response.
2. Add the <active-response> block below to the Wazuh server /var/ossec/etc/ossec.conf configuration file:
<ossec_config>
  <active-response>
    <command>restart-wazuh</command>
    <location>local</location>
    <rules_id>100009</rules_id>
  </active-response>
</ossec_config>
<command>: Specifies the command to configure. This is the command namerestart-wazuhdefined in the previous step.<location>: Specifies where the command executes. Using thelocalvalue here means that the command executes on the monitored endpoint where the trigger event occurs.<rules_id>: The active response module executes the command if rule ID100009fires.
3. Add the rules below to the Wazuh server /var/ossec/etc/rules/local_rules.xml configuration file:
<group name="restart,">
  <rule id="100009" level="5">
    <if_sid>550</if_sid>
    <match>ossec.conf</match>
    <description>Changes made to the agent configuration file - $(file)</description>
  </rule>
</group>
This rule detects changes in the Wazuh agent configuration file.
4. Restart the Wazuh manager service to apply changes:
Configuring the Ubuntu endpoint
1. Edit the /var/ossec/etc/ossec.conf file and add the following configuration to the <syscheck> section:
<directories realtime="yes">/var/ossec/etc/ossec.conf</directories>
This monitors the Wazuh agent configuration file for any changes.
2. Restart the Wazuh agent service to apply changes:
Test the configuration
1. Add the following block in the <syscheck> block of the Wazuh agent /var/ossec/etc/ossec.conf configuration file and save it:
<directories realtime="yes">/root</directories> 
This addition allows monitoring file changes in the /root directory of the monitored endpoint. There’s no need to actually add or modify files. It’s just to test the configuration.
Warning: Incorrect modifications to the Wazuh agent configuration file might cause the service to crash. It’s important to thoroughly review any changes before implementing them in a production environment.
Visualize the alerts
It becomes apparent that immediately following modifications to the configuration file, the active-response feature was activated, leading to a restart of the Wazuh agent.

The active response log also displays when the active response kicks in.

Conclusion
With active response, Wazuh can take action to mitigate risks automatically based on detected threats. Disabling a compromised account or restarting an unstable agent are examples of incident responses that Wazuh can execute autonomously.
System inventory
Introduction
Maintaining an up-to-date inventory of hardware and software assets is imperative for security. This segments will showcase how Wazuh scans endpoints to collect installed applications, running processes, network data, and other system details.
Configuration
The Syscollector module is enabled by default on all endpoints where the Wazuh agent is installed. The Syscollector configuration can be modified in the Wazuh agent configuration file at:
/var/ossec/etc/ossec.conffor Linux endpoints.C:\Program Files (x86)\ossec-agent\ossec.conffor Windows endpoints./Library/Ossec/ossec.conffor macOS endpoints.
The centralized configuration file can be utilized to modify the Syscollector module on multiple monitored endpoints within a single agent group. For instance, the configuration file for the default group is located at /var/ossec/etc/shared/default/agent.conf on the Wazuh server. Changes made in the centralized configuration will override the local agent configuration.
The block below is the default Syscollector configuration present in the Wazuh agent configuration file:
<!-- System inventory -->
   <wodle name="syscollector">
     <disabled>no</disabled>
     <interval>1h</interval>
     <scan_on_start>yes</scan_on_start>
     <hardware>yes</hardware>
     <os>yes</os>
     <network>yes</network>
     <packages>yes</packages>
     <ports all="no">yes</ports>
     <processes>yes</processes>

     <!-- Database synchronization settings -->
     <synchronization>
       <max_eps>10</max_eps>
     </synchronization>
   </wodle>
Where:
<disabled>specifies whether the Syscollector module is enabled or not. The default value isno. The allowed values areyesandno.<interval>specifies the time between system scans. The default value is 1 hour. The allowed value is a positive number that should contain a suffix character indicating a time unit, such ass(seconds),m(minutes),h(hours), andd(days).<scan_on_start>initiates a system scan immediately after you restart the Wazuh service on the endpoint. The default value isyes. The allowed values areyesandno.<hardware>option enables or disables the hardware information collection by Syscollector. The default value isyes. The allowed values areyesandno.<os>option enables or disables the operating system scan. The default value isyes. The allowed values areyesandno.<network>enables or disables the network scan. The default value isyes. The allowed values areyesandno.<packages>enables or disables the scanning of packages with a default value ofyes. The allowed values areyesandno.<ports all="no">enables or disables the port scan. The default value isyes. You can configure two allowed values ofyesandno. This option also accepts an additional parameterall, with which you can restrict the scan to only listening ports using<ports all="no">. If you want Syscollector to scan all ports, then you change the value toyes.<processes>enables or disables the scanning for running processes on a monitored endpoint. The default value ofyes. The allowed values areyesandno.<max_eps>allows you to set the maximum event reporting throughput. The default value is 10, which signifies 10 events per second. The allowed value is an Integer number between 0 and 1000000.
Restart the agent when changes to the configuration file are made. If the section on”Restarting the Wazuh agent with active response” was implemeted, saving the changes made would activate the active-response of restarting the agent.
Viewing system inventory data
Wazuh dashboard
View the system inventory of each monitored endpoint from the Wazuh dashboard by select an agent from the Wazuh dashboard and navigate to the Inventory data tab as displayed below. The inventory data page for each monitored endpoint shows its operating system, hardware, processes, network interface, and packages.

Query the agent inventory database
The Syscollector module conducts regular scans and transmits the updated data to the Wazuh server in JSON format. The information is then analyzed and stored in individual databases for each endpoint by the Wazuh server. These databases consist of tables that store various types of system data. By utilizing the Wazuh API or the SQLite tool, specific information can be retrieved from the database through queries.
Using SQLite
The database for each monitored endpoint is located on the Wazuh server at /var/ossec/queue/db/. Directly querying each database is possible. To establish a connection with an endpoint’s database, utilize the following command:
sqlite3 /var/ossec/queue/db/<AGENT_ID>.dbWhere <AGENT_ID> corresponds to the agent ID of the monitored endpoint.
Get the Ubuntu Agent ID with
sudo /var/ossec/bin/agent_control -l
Output:
SQLite version 3.7.17 2013-05-20 00:56:22
Enter ".help" for instructions
Enter SQL statements terminated with a ";"
sqlite>
After connecting to the database, query the list of tables in it using the command below:
sqlite>.tables
Generating system inventory reports
There are two categories of reports that can be generated on the Wazuh dashboard: the property-specific report and the endpoint inventory report.
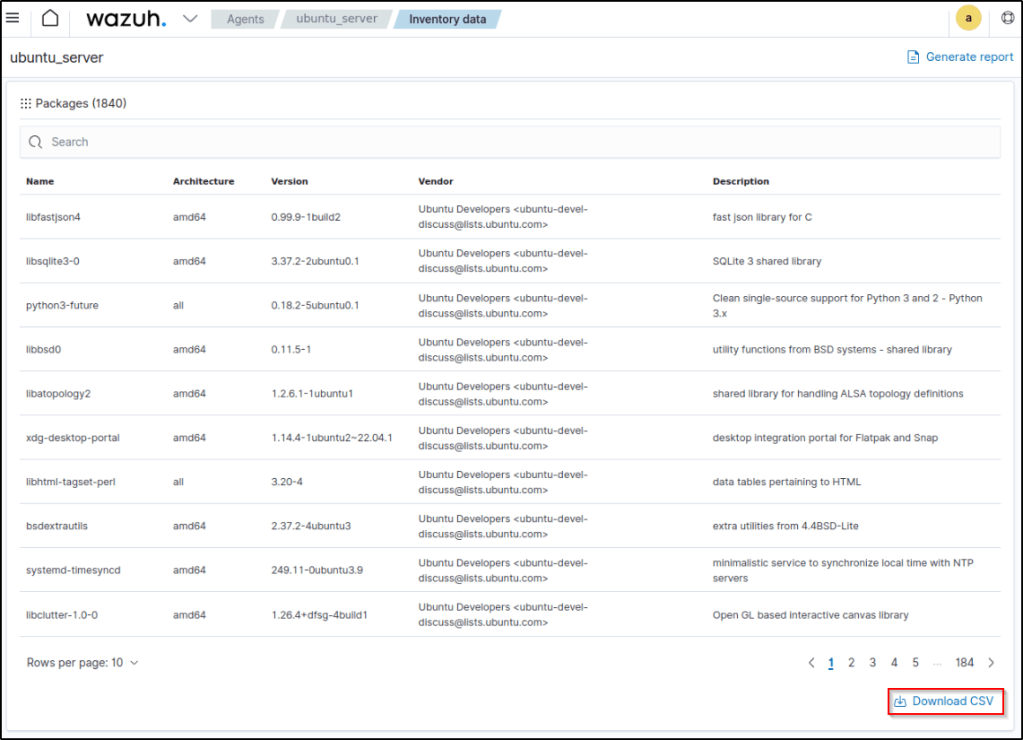
Property-specific report
This functionality enables the exportation of CSV reports for a particular endpoint’s property. An example would be generating a report for the software installed on an endpoint. These reports are exclusively accessible for processes and installed software. To obtain the report, simply click on the Download CSV button located below the desired property on the Inventory data page of the endpoint.
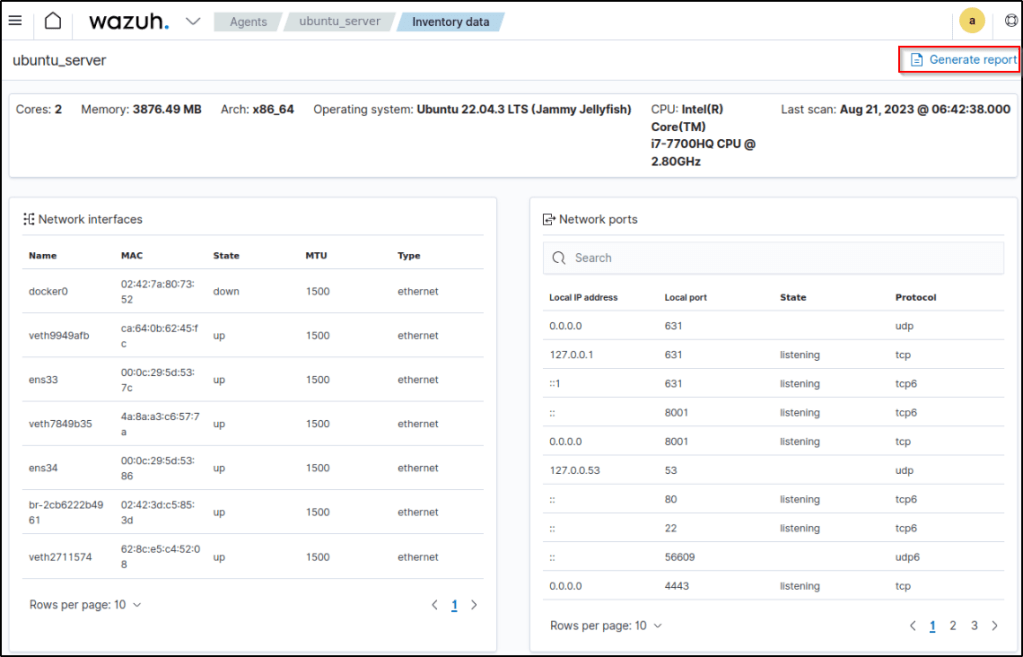
Endpoint inventory report
This functionality enables the exporting of a comprehensive report encompassing all endpoint properties collected by the Wazuh Syscollector module. This report is generated in PDF format and can be utilized for various purposes. To obtain the complete endpoint report, follow these steps:
- Click on Generate Report on the Inventory data page of the Wazuh agent.
Using Syscollector information to trigger alerts
Note: This feature has been enabled again in Wazuh 4.4.
One can establish rules to activate alerts based on the data collected by the Syscollector module and display the relevant information in the description of these alerts. By specifying the <decoded_as> field as syscollector in a rule declaration, it is possible to achieve this. The Syscollector module utilizes the event ID 221, and the default rule level is set to 0, meaning that it is not displayed on the Wazuh dashboard by default. Through the use of the <if_sid>221</if_sid> tag within a custom rule, it becomes feasible to create rules that produce alerts visible on the Wazuh dashboard. For example, the given custom rules trigger alerts when a port is opened, modified, or closed.
<group name="syscollector,">
  <!-- ports -->
  <rule id="100310" level="3" >
      <if_sid>221</if_sid>
      <field name="type">dbsync_ports</field>
      <description>Syscollector ports event.</description>
  </rule>

  <rule id="100311" level="3" >
      <if_sid>100310</if_sid>
      <field name="operation_type">INSERTED</field>
      <description>The port: $(port.local_port), with local ip: $(port.local_ip) has been opened. Syscollector creation event detected.</description>
  </rule>

  <rule id="100312" level="3" >
      <if_sid>100310</if_sid>
      <field name="operation_type">MODIFIED</field>
      <description>The port: $(port.local_port), with local ip: $(port.local_ip) has been modified. Syscollector modification event detected.</description>
  </rule>

  <rule id="100313" level="3" >
      <if_sid>100310</if_sid>
      <field name="operation_type">DELETED</field>
      <description>The port: $(port.local_port), with local ip: $(port.local_ip) has been closed. Syscollector deletion event detected.</description>
  </rule>
</group>
The alert for a port opening operation is displayed in the Wazuh dashboard as follows:

Conclusion
Wazuh system inventory provides comprehensive visibility into endpoint compositions and versions. By tracking components like installed packages and running kernels, Wazuh supports vulnerability management, license compliance, and configuration control.
Osquery
Introduction
Osquery is an open-source tool that enables SQL querying of operating system data. By integrating it with Wazuh, administrators can gain valuable insights into running processes, loaded kernel modules, and other low-level system information. This powerful combination enhances security monitoring and threat detection capabilities.
How it works
Osquery enables the exposure of an operating system as a high-performance relational database, facilitating the exploration of operating system data through SQL-based queries.
Below are some examples of the queries:
List all the local users of the machine.
SELECT * FROM users;Get the process name, port, and PID, for processes listening on all interfaces.
SELECT DISTINCT processes.name, listening_ports.port, processes.pid FROM listening_ports JOIN processes USING (pid) WHERE listening_ports.address = '0.0.0.0';Check the processes that have a deleted executable.
SELECT * FROM processes WHERE on_disk = 0;A complete list of all the available tables can be found here.
Configuring the Ubuntu Endpoint
A working Osquery installation is required in the endpoint system. See downloads page for details.
Debian and Ubuntu based Linux distributions:
export OSQUERY_KEY=1484120AC4E9F8A1A577AEEE97A80C63C9D8B80B
apt-key adv --keyserver keyserver.ubuntu.com --recv-keys $OSQUERY_KEY
add-apt-repository 'deb [arch=amd64] https://pkg.osquery.io/deb deb main'
apt-get update
apt-get install osquery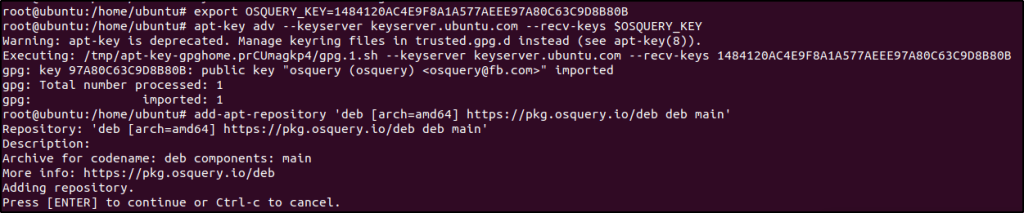
Once installed, a configuration file for Osquery is needed. The following configuration provided by Osquery can be used, which I used in this example:
cp /opt/osquery/share/osquery/osquery.example.conf /etc/osquery/osquery.confOr copy the custom configuration in /etc/osquery/osquery.conf which I did:
{
"options": {
"config_plugin": "filesystem",
"logger_plugin": "filesystem",
"utc": "true"
},
"schedule": {
"system_info": {
"query": "SELECT hostname, cpu_brand, physical_memory FROM system_info;",
"interval": 3600
},
"high_load_average": {
"query": "SELECT period, average, '70%' AS 'threshold' FROM load_average WHERE period = '15m' AND average > '0.7';",
"interval": 900,
"description": "Report if load charge is over 70 percent."
},
"low_free_memory": {
"query": "SELECT memory_total, memory_free, CAST(memory_free AS real) / memory_total AS memory_free_perc, '10%' AS threshold FROM memory_info WHERE memory_free_perc < 0.1;",
"interval": 1800,
"description": "Free RAM is under 10%."
}
},
"packs": {
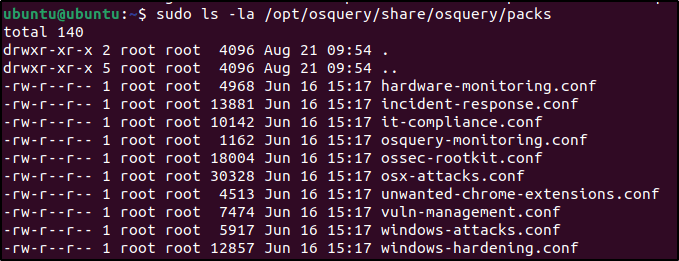
"osquery-monitoring": "/opt/osquery/share/osquery/packs/osquery-monitoring.conf",
"incident-response": "/opt/osquery/share/osquery/packs/incident-response.conf",
"it-compliance": "/opt/osquery/share/osquery/packs/it-compliance.conf",
"vuln-management": "/opt/osquery/share/osquery/packs/vuln-management.conf",
"hardware-monitoring": "/opt/osquery/share/osquery/packs/hardware-monitoring.conf",
"ossec-rootkit": "/opt/osquery/share/osquery/packs/ossec-rootkit.conf"
}
}
Osquery packs are collections of pre-defined SQL queries, tables, and plugins that enhance the capabilities of osquery for specific tasks such as security monitoring, compliance, and forensic analysis.
After this enable and start the osquery Daemon:
systemctl enable osqueryd
systemctl start osqueryd
And the osquery module must be enabled for the agents where the osquery is running by adding:
<wodle name="osquery"/>
Note: More options may be specified as shown in the osquery configuration reference
In this particular example, the block is configured to execute queries such as system_info, high_load_average, and low_free_memory on an hourly basis.
Additionally, the given setup employs various default packs like osquery-monitoring, hardware-monitoring, and ossec-rootkit, among others. Custom packs can also be defined and utilized with this module.
Visualization
Osquery events can be viewed in the Osquery module.
Here are some charts showing different osquery events.


Conclusion
Osquery is a powerful endpoint query tool that enables users to uncover hidden system configurations and activities. By accessing and analyzing system data through a SQL-like interface, osquery enhances visibility and security. It helps identify vulnerabilities, detect malicious behaviors, and proactively address security risks, ultimately strengthening overall system defenses.
Conclusion
In this article, I demonstrated practical uses of essential Wazuh agent capabilities such as system call monitoring, security configuration checks, active response, inventory tracking, and osquery integration. Analyzing system calls exposed malicious Linux process behavior, while assessing configurations verified policy compliance. Active response automated threat response actions, and system inventory provided asset visibility. Lastly, osquery empowered system data access.
These key features work round the clock to detect threats, enforce desired settings, take action on incidents, inform decisions, and enable queries.
This wraps up my walkthrough of demonstrating Wazuh capabilities on an Ubuntu endpoint. In the next post, I’ll showcase practical examples of leveraging Wazuh for security monitoring and protection on a Windows machine. The goal will be to provide an overview look at Wazuh’s versatility across both Linux and Windows environments.
References
Thanks for reading. Until next time. 🙂

Leave a comment