
Introduction
In my previous posts, I walked through installing Wazuh, deploying agents, and demonstrating core capabilities like file integrity monitoring and malware detection on a Windows endpoint. In this final installment, I’ll showcase a few additional key capabilities of Wazuh on Windows, including security configuration assessments, active response, log analysis, and system inventory tracking. These components round out a robust toolkit for endpoint detection and response.
Security Configuration Assessment
The Security Configuration Assessment (SCA) module helps ensure that systems are correctly set up and utilized in accordance with predetermined guidelines. It conducts scans and examines the configuration of monitored endpoints to detect and rectify any vulnerabilities or incorrect settings, thereby reducing the likelihood of attacks. With SCA in Wazuh, recommendations for fixing issues are provided based on the scan findings.
How to configure SCA
Wazuh agents are bundled with the necessary policies for their specific operating system upon installation. The comprehensive list of officially supported policy files in the table called “Available SCA Policies” can be accessed here. These policies are included with the Wazuh server installation, making it effortless to enable them.
For a detailed description of the various configuration parameters of SCA, check the SCA reference.
Enabling and disabling policies
By default, the Wazuh agent runs scans for every policy (.yaml or .yml files) present in the ruleset folder:
- Windows agents:
C:\Program Files (x86)\ossec-agent\ruleset\sca.
Note: The contents of the above-mentioned folders for default rulesets are not retained throughout installations or updates. It is advisable to place them in a different folder if changes or new policies are made.
In order to incorporate a policy file located outside the installation folder of the Wazuh agent, it is necessary to include the path of the policy file in the <sca> block within the configuration file of the Wazuh agent. A sample configuration is provided as follows:
<sca>
  <policies>
    <policy><FULLPATH_TO_CUSTOM_SCA_POLICY_FILE></policy>
  </policies>
</sca>
A relative path to the Wazuh installation directory can also be configured:
<sca>
  <policies>
    <policy>etc/shared/<CUSTOM_SCA_POLICY_FILE></policy>
  </policies>
</sca>
To deactivate policies on the Wazuh agent, rename the policy file and change its YAML extension to something other than .yaml or .yml, such as adding .disabled at the end.
The second way to deactivate the policies is by including a line in the ossec.conf file of the Wazuh agent like the one shown below in the <policy> section of the SCA module:
<sca>
  <policies>
    <policy enabled="no">C:\Program Files (x86)\ossec-agent\custom-sca-files\<POLICY_FILE_TO_DISABLE></policy>
  </policies>
</sca>
How to share policy files and configuration with the Wazuh agents
The Wazuh manager has the ability to distribute files and configurations to Wazuh agents that are connected, as stated in the centralized configuration section of the documentation.
This feature can be enabled to push policy files to the Wazuh agents in defined groups. By default, every Wazuh agent belongs to the default group, which is used here as an example:
1. On the Wazuh agent, edit the local_internal_options.conf file to allow the execution of commands in SCA policies sent from the Wazuh server:
echo "sca.remote_commands=1" >> C:\Program Files (x86)\ossec-agent\local_internal_options.confNote:By enabling remote command execution, the Wazuh server gains the ability to execute commands on the monitored endpoint. Remote commands are disabled by default as a security measure, which helps reduce the attack surface in case the Wazuh server is compromised.
Enabling the remote commands is not requried if the policy files are added to each agent without using the Wazuh server to push them. For example, policy file can be manually created directly on the monitored endpoint, or use scp to copy the policy file to the monitored endpoint.
2. On the Wazuh server, place a new policy file in the /var/ossec/etc/shared/default folder and change its ownership. Replace <NEW_POLICY_FILE> with a policy name.
chown wazuh:wazuh /var/ossec/etc/shared/default/<NEW_POLICY_FILE>3. Add the following configuration block to the Wazuh server /var/ossec/etc/shared/default/agent.conf file to configure the new policy file in the Wazuh agent:
<agent_config>
  <!-- Shared agent configuration here -->
  <sca>
    <policies>
        <policy>etc/shared/<NEW_POLICY_FILE></policy>
    </policies>
  </sca>
</agent_config>
The new <sca> block in the Wazuh server /var/ossec/etc/shared/default/agent.conf file is merged with the <sca> block on the Wazuh agent side, and the new configuration is added.
Available SCA policies
Below is a list of SCA policies already included in Wazuh by default. The Wazuh agent will install the appropriate policy file based on the operating system of the endpoint.
Available SCA policies for my Windows endpoint.
| Policy | Name | Target |
|---|---|---|
| cis_win11_enterprise | CIS Benchmark for Windows 11 Enterprise | Windows 11 |
Use cases
This section shows some custom SCA use cases for various operating systems.
The use cases covered in this section include Detecting keyword in a file and Detecting a running process.
Detecting keyword in a file
Configuring the Windows endpoint
Create the file C:\Program Files\testfile.txt and monitor the file using the Wazuh SCA module.
1. Run PowerShell as an administrator and create the test file and add some text to it, including the keyword password_enabled: yes:
New-Item "C:\Program Files\testfile.txt" -ItemType File -Value "config_file`nsecond line of configuration`npassword_enabled: yes"2. Verify that the file has been created:
Get-Content "C:\Program Files\testfile.txt"Output should be similar to the following:
config_file
second line of configuration
password_enabled: yes
3. Create a new directory to save the custom policy files:
New-Item "C:\Program Files (x86)\ossec-agent\custom-sca-files" -itemType Directory
4. Open Notepad as an administrator, create a new SCA policy file with the following content and save it as C:\Program Files (x86)\ossec-agent\custom-sca-files\keywordcheck.yml:
policy:
  id: "keyword_check_windows"
  file: "keywordcheck.yml"
  name: "SCA use case: Keyword check"
  description: "Guidance for checking for a keyword or phrase in files on Windows."
  references:
    - https://documentation.wazuh.com/current/user-manual/capabilities/sec-config-assessment/index.html
    - https://documentation.wazuh.com/current/user-manual/capabilities/sec-config-assessment/creating-custom-policies.html
requirements:
  title: "Check that the desired file exists on the monitored endpoints"
  description: "Requirements for running the SCA scans against endpoints with testfile.txt on them."
  condition: any
  rules:
    - 'f:C:\Program Files\testfile.txt'
checks:
  - id: 10001
    title: "Ensure password is disabled in the test configuration file"
    description: "Password is enabled in the test configuration file."
    rationale: "Password is considered weak for the custom test application. Threat actors can brute-force your password."
    remediation: "Disable password by setting the value of the password_enabled option to no."
    condition: none
    rules:
- 'f:C:\Program Files\testfile.txt -> r:^password_enabled: yes$'- This create a requirement to ensure that the policy runs only if the file
C:\Program Files\testfile.txtexists on the endpoint. - Check ID
10001scans the fileC:\Program Files\testfile.txtto find any line that contains the stringpassword_enabled: yes. Thenonecondition ensures that the check fails if a match is found.

5. Enable the policy file by adding the following lines to the <ossec_config> block of the Wazuh agent configuration file at /var/ossec/etc/ossec.conf:
<sca>
  <policies>
    <policy enabled="yes">C:\Program Files (x86)\ossec-agent\custom-sca-files\keywordcheck.yml</policy>
  </policies>
</sca>
The other settings are default.
6. Restart the Wazuh agent to apply the changes and to run the new SCA check:
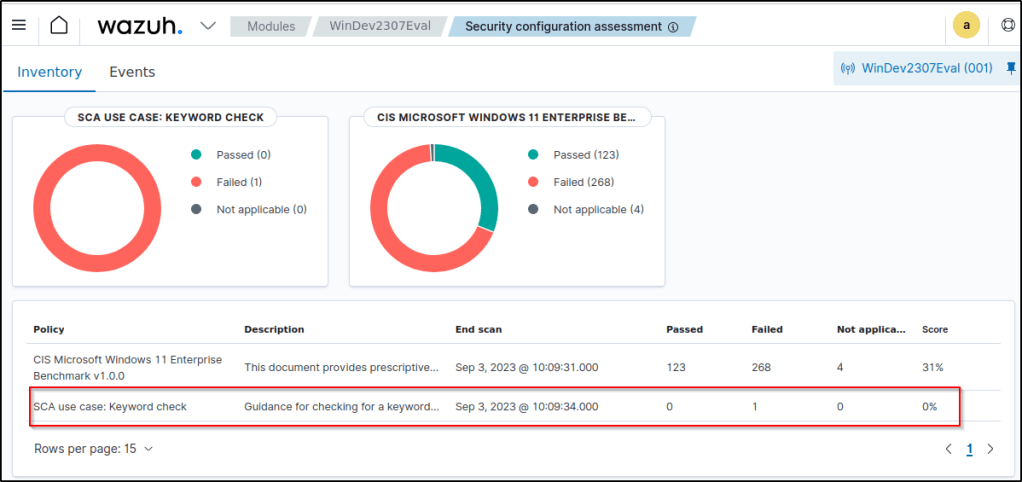
Navigate to the SCA tab and select the Windows endpoint to view the results of the custom SCA check that have been created.
The following two images are the checks from the default SCA policy.


What follows are the checks from the SCA policy that was created.


Detecting a running process
This sub-section presents how to detect running processes with the Wazuh SCA module.
Configuring the Windows endpoint
PowerShell is commonly used by system administrators to configure systems. However, regular users tend to use it less often. Malicious individuals may exploit PowerShell as part of a “living-off-the-land” attack strategy. To set up the Wazuh SCA module for detecting PowerShell processes and simulating an attack, following are the instructions:
1. Run CMD as an administrator and create a new directory to save the custom policy files( which I have already done in the previous use case):
mkdir "C:\Program Files (x86)\ossec-agent\custom-sca-files"3. Open Notepad as an administrator, create a new SCA policy file with the following content and save it as C:\Program Files (x86)\ossec-agent\custom-sca-files\processcheck.yml:
policy:
id: "process_check"
file: "processcheck.yml"
name: "SCA use case to detect running processes"
description: "Guidance for checking running PowerShell processes on Windows 10 endpoints."
references:
- https://documentation.wazuh.com/current/user-manual/capabilities/sec-config-assessment/index.html
- https://documentation.wazuh.com/current/user-manual/capabilities/sec-config-assessment/creating-custom-policies.html
requirements:
title: "Check that the Windows platform is Windows 10"
description: "Requirements to check if it's a Windows 10 (or Windows 11) machine"
condition: all
rules:
- 'r:HKLM\SOFTWARE\Microsoft\Windows NT\CurrentVersion -> ProductName -> r:^Windows 10'
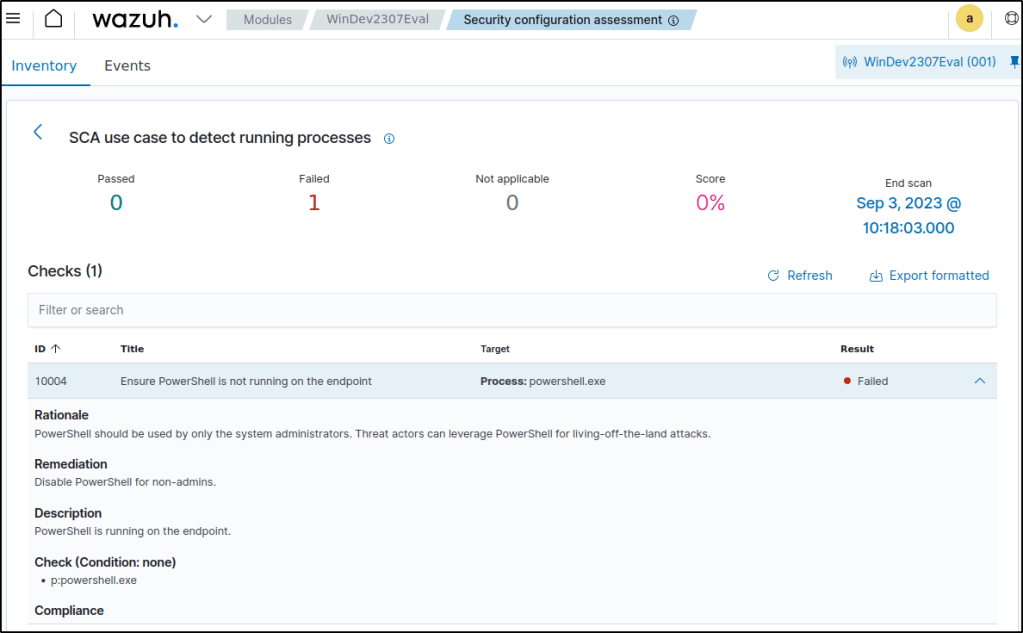
checks:
- id: 10004
title: "Ensure PowerShell is not running on the endpoint"
description: "PowerShell is running on the endpoint."
rationale: "PowerShell should be used by only the system administrators. Threat actors can leverage PowerShell for living-off-the-land attacks."
remediation: "Disable PowerShell for non-admins."
condition: none
rules:
- 'p:powershell.exe'- This creates a requirement to ensure that the policy runs only on Windows 10 endpoints. The requirement checks the registry key
HKLM\SOFTWARE\Microsoft\Windows NT\CurrentVersionfor the valueWindows 10. - Check ID
10004scans the endpoint for processes namedpowershell.exe. Thenonecondition ensures that the check fails if a match is found.

3. Enable the policy file by adding the following lines to the <ossec_config> block of the Wazuh agent configuration file at /var/ossec/etc/ossec.conf:
<sca>
  <policies>
    <policy enabled="yes">C:\Program Files (x86)\ossec-agent\custom-sca-files\processcheck.yml</policy>
  </policies>
</sca>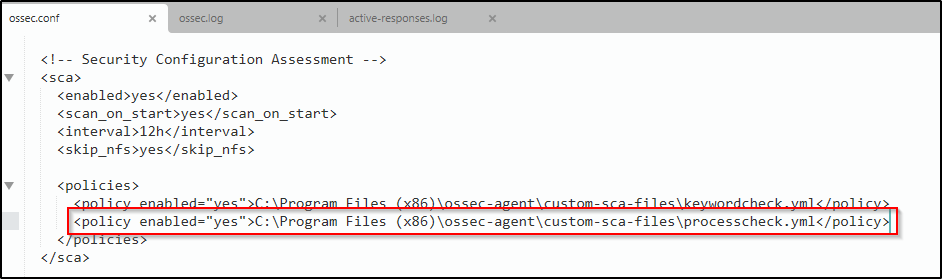
4. Open a second command prompt and run the following command to spawn a hidden PowerShell process. This is a dummy Powershell process that sleeps for 300 seconds (5 minutes), enough time for you to restart the Wazuh agent for the SCA scan to run.
powershell -windowstyle hidden -command Start-Sleep -Seconds 300
Note: The command prompt closes after this command is execute and PowerShell runs in the background.
5. Run the following commands on CMD as an Administrator to restart the Wazuh agent:
NET STOP Wazuh
NET START Wazuh
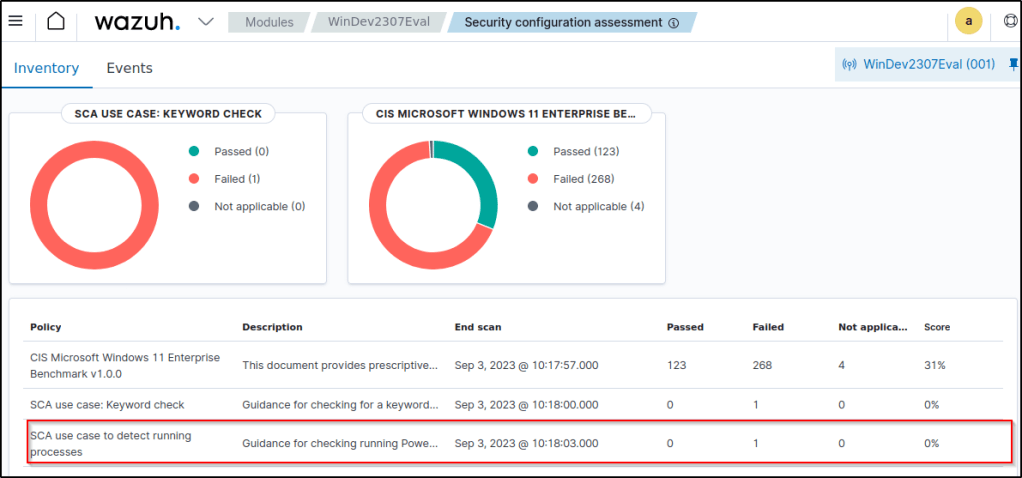
Navigate to the SCA tab and select the Windows endpoint to view the results of the custom SCA check that was created.
Active response
Wazuh can automate actions to contain threats through active response capabilities. The proof of concept here includes restarting the wazuh agent right after editing and saving the changes made to the agent configuration file.
Configuring the Wazuh server
1. Check the configuration of the <command> block in the Wazuh server /var/ossec/etc/ossec.conf configuration file. Add one if it doesn’t exist already.
The <command> block configures the execution of a script triggered by an event. By default, the Wazuh server includes predefined active response scripts with their corresponding <command> blocks in the /var/ossec/etc/ossec.conf file. These blocks are not necessary for custom active response scripts, which require manual addition of the corresponding <command> blocks within the <ossec_config> tags in the Wazuh server configuration file. For instance:
<command>
  <name>host-deny</name>
  <executable>host-deny</executable>
  <timeout_allowed>yes</timeout_allowed>
</command>
Where:
<name>: Sets a name for the command. In this case,host-deny.<executable>: Specifies the active response script or executable that must run upon a trigger. You don’t need to specify the file name extension unless you have multiple scripts sharing the same name. In this case, it’s thehost-denyexecutable.<timeout_allowed>: Allows a timeout after a period of time. Setting this value toyesreverts the action after a period of time. Check stateful active response below for more details.
Refer to the command section for more information and options used to create a command.
2. Add an <active-response> block inside the <ossec_config> tag in the /var/ossec/etc/ossec.conf file of the Wazuh server. This block specifies the conditions under which a command is executed, such as when an alert matches certain criteria like rule ID, alert level, or rule group. It also determines whether the command is executed on the Wazuh agent, Wazuh server, or all devices. For instance:
<active-response>
  <command>host-deny</command>
  <location>local</location>
  <level>7</level>
  <timeout>600</timeout>
</active-response>
Where:
<command>: Specifies the command to configure. This is the command name defined in the previous step.<location>: Specifies where the command must execute. The options are:local: It runs the script on the monitored endpoint that generated the alert.server: It runs the script on the Wazuh server.defined-agent: It runs the script on a predefined agent. Use the<agent_id>tag to specify the ID of the Wazuh agent that must run the script regardless of where the event occurred. For example:
<ossec_config>
  <active-response>
    <disabled>no</disabled>
    <command>host-deny</command>
    <location>defined-agent</location>
    <agent_id>001</agent_id>
    <level>10</level>
    <timeout>180</timeout>
  </active-response>
</ossec_config>all: Every Wazuh agent in the environment must run the script. Use this option with caution. Incorrect configuration can cause problems in your environment.
Refer to the active response configuration section for more information on the supported options.
3. Restart the Wazuh manager to apply all the changes made.
Configuring the monitored endpoint
Using out-of-the-box active response scripts
Custom active response script or executable are added to the C:\Program Files (x86)\ossec-agent\active-response\bin directory.
Note: Results of the execution of the active response scripts are logged in the C:\Program Files (x86)\ossec-agent\active-response\active-responses.log file.
Default active response scripts
Below are compiled, pre-installed scripts for Windows endpoints. These scripts are stored in the C:\Program Files (x86)\ossec-agent\active-response\bin directory of the Wazuh agent.
| Name of script | Description |
|---|---|
| netsh.exe | Blocks an IP address using netsh. |
| restart-wazuh.exe | Restarts the Wazuh agent. |
| route-null.exe | Adds an IP address to null route. |
Restarting the Wazuh agent with active response
Configuring the Wazuh server
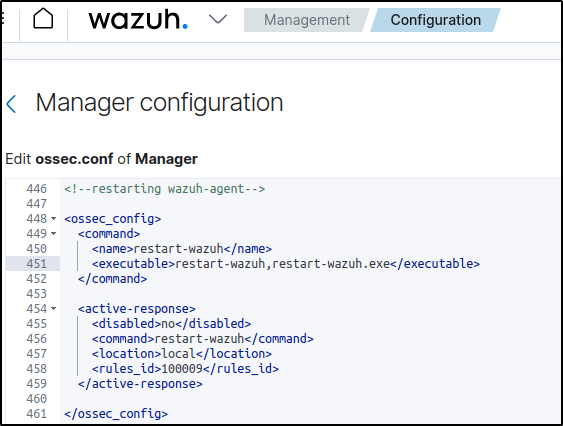
1. Open the Wazuh server /var/ossec/etc/ossec.conf file and verify that a <command> block called restart-wazuh with the following configuration is present within the <ossec_config> block:
<command>
  <name>restart-wazuh</name>
  <executable>restart-wazuh,restart-wazuh.exe</executable>
</command>
The <command> block contains information about the action to be executed on the Wazuh agent:
<name>: Sets a name for the command. In this case,restart-wazuh.<executable>: Specifies the active response script or executable that must run after a trigger. In this case, it’s therestart-wazuhexecutable.<timeout_allowed>: Allows a timeout after a period of time. This tag is set to no here, which represents a stateless active response.
2. Add the <active-response> block below to the Wazuh server /var/ossec/etc/ossec.conf configuration file:
<ossec_config>
  <active-response>
    <command>restart-wazuh</command>
    <location>local</location>
    <rules_id>100009</rules_id>
  </active-response>
</ossec_config><command>: Specifies the command to configure. This is the command namerestart-wazuhdefined in the previous step.<location>: Specifies where the command executes. Using thelocalvalue here means that the command executes on the monitored endpoint where the trigger event occurs.<rules_id>: The active response module executes the command if rule ID100009fires.
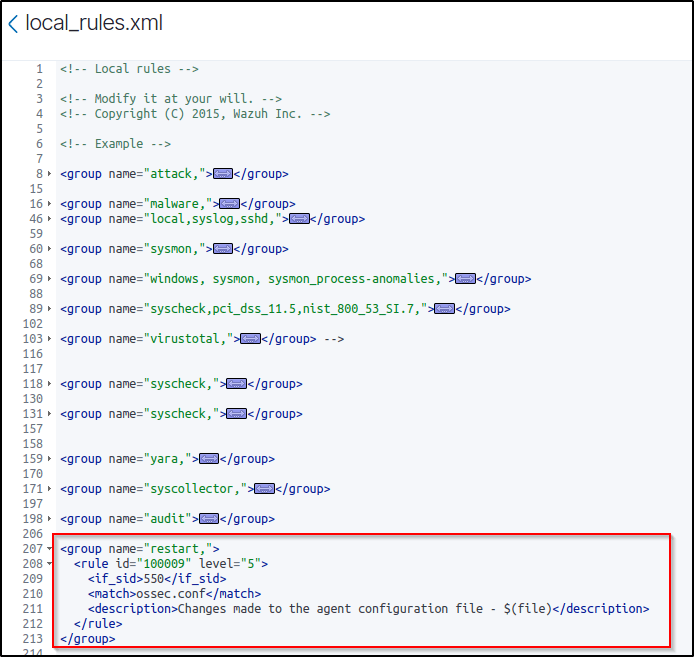
3. Add the rules below to the Wazuh server /var/ossec/etc/rules/local_rules.xml configuration file:
<group name="restart,">
  <rule id="100009" level="5">
    <if_sid>550</if_sid>
    <match>ossec.conf</match>
    <description>Changes made to the agent configuration file - $(file)</description>
  </rule>
</group>
This rule detects changes in the Wazuh agent configuration file.
4. Restart the Wazuh manager service to apply changes.
configuring the Windows endpoint
1. Edit the C:\Program Files (x86)\ossec-agent\ossec.conf file and add the following configuration to the <syscheck> section:
<directories realtime="yes">C:\Program Files (x86)\ossec-agent\ossec.conf</directories>This monitors the Wazuh agent configuration file for any changes.

2. Restart the Wazuh agent service to apply changes.
Test the configuration
1. Add the following block in the <syscheck> block of the Wazuh agent C:\Program Files (x86)\ossec-agent\ossec.conf
<directories realtime="yes">C:\Apache24</directories> 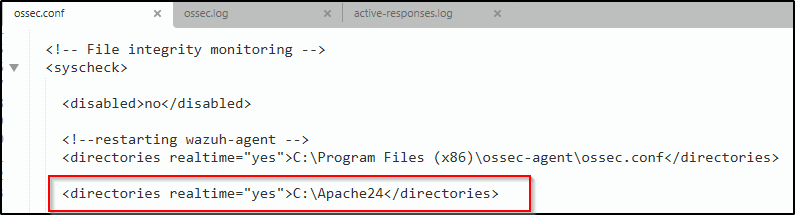
This addition allows monitoring file changes in the C:\Apache24 directory and there’s no need to actually add or modify files. It’s just to test the configuration.
Visualizing the alerts
It is seen that once changes are made to the configuration file, the active response kicks in and restarts the wazuh agent.

The successful active response is logged in the active-response.log.

Log data collection
Log data collection is the process of gathering and combining logs from various sources in a network. It helps security teams with regulatory compliance, threat detection, and identifying application errors and security issues. Wazuh is a tool that helps gather and analyze logs from different devices like computers, networks, and applications. The logs are collected by Wazuh agents installed on each device and sent to the Wazuh server. Other methods, like syslog, can also be used to send log messages to the server.
Use cases
Detecting the installation of applications on Windows
In this use case, Wazuh will detect when an application is installed on a Windows endpoint. In this use case, an application called Dr. Memory will be installed.
Dr. Memory is a powerful tool for monitoring memory that can identify memory errors, such as invalid memory accesses, memory leaks, and handle leaks. It also detects accesses to freed memory and other related memory problems.
Windows endpoint
1. Download and install Dr. Memory.

By default, the Wazuh agent monitors the installation of applications using the configuration below located in the Wazuh agent configuration file C:\Program Files (x86)\ossec-agent\ossec.conf:
<localfile>
  <location>Application</location>
  <log_format>eventchannel</log_format>
</localfile>
Wazuh server
Wazuh has a built-in rule 60612 to detect when an application is installed on a Windows endpoint which can be viewed in the /var/ossec/ruleset/rules/0585-win-application_rules.xml rule file on the Wazuh server.
<rule id="60612" level="3">
  <if_sid>60609</if_sid>
  <field name="win.system.eventID">^11707$|^1033$</field>
  <options>no_full_log</options>
  <description>Application installed $(win.eventdata.data).</description>
</rule>
Test the configuration
Apply the filter rule.id:60612 to view the alerts.

Monitoring PowerShell activity
Wazuh is set up to identify instances where a PowerShell script is executed.
Windows endpoint
Perform the following steps to enable PowerShell logging on a Windows endpoint and configure the Wazuh agent to monitor logged PowerShell activities.
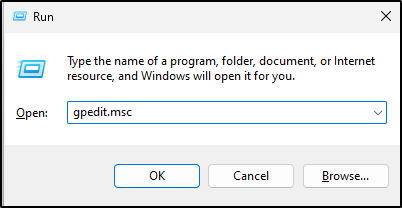
1. Press Windows + R keys on your keyboard to open the run dialog box.
2. Type gpedit.msc in the search box and click OK to open the local group policy editor.
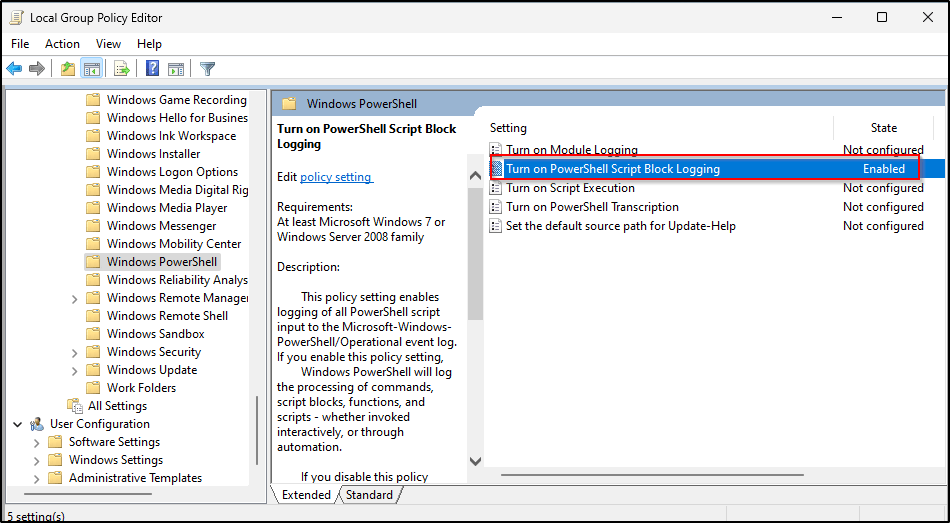
3. Navigate to Computer Configuration > Administrative Templates > Windows Components > Windows PowerShell > Turn on PowerShell Script Block Logging.
Note: Turning on PowerShell Script Block Logging will log a lot of PowerShell events in the Microsoft-Winndows-PowerShell/Operational event channel.
4. Select Enabled, and then click OK.

5. Add the following in between the <ossec_config> tags of the Wazuh agent configuration file C:\Program Files (x86)\ossec-agent\ossec.conf to monitor PowerShell logs:
<localfile>
  <location>Microsoft-Windows-PowerShell/Operational</location>
  <log_format>eventchannel</log_format>
</localfile>
6. Restart the Wazuh agent via PowerShell with administrator privileges to apply the change.
Test the configuration
I executed a PowerView script with PowerShell and performed a simple enumeration.
. .\PowerView.ps1
Get-Netdomain
Note: It is highly recommended to run the above command in a sandbox environment, and not in a production environment.
On the Wazuh dashboard, alerts are generated for monitored PowerShell activities. Examples include the detection of an “Invoke-Command” and “Possible domain SID enumeration.”

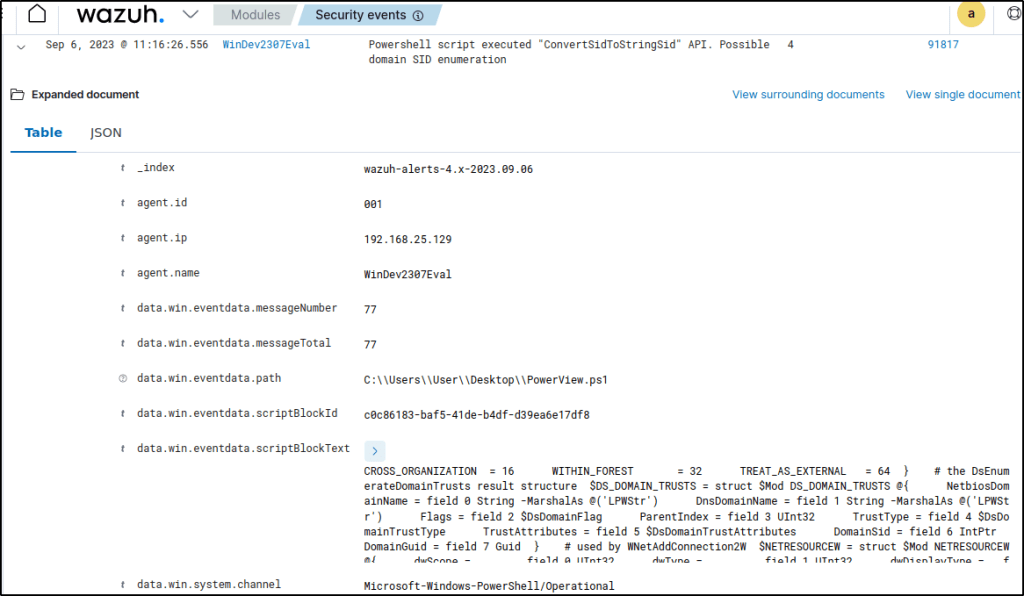
The built-in rules that were triggered are found in the /var/ossec/ruleset/rules/0915-win-powershell_rules.xml file on the Wazuh server.
Vulnerability detection
Vulnerabilities are security flaws in computer systems that can be exploited by hackers. It is important for organizations to quickly detect and fix these vulnerabilities to protect their network and data. The Wazuh Vulnerability Detector module helps users find vulnerabilities in operating system and applications. It works by integrating with external vulnerability feeds to provide accurate and up-to-date information.
How it works
To detect vulnerabilities, Wazuh agents collect a list of installed applications from monitored endpoints and send it periodically to the Wazuh server. Local SQLite databases in the Wazuh server store this list. Also, the Wazuh server builds a global vulnerability database from publicly available CVE repositories. It uses this database to cross-correlate this information with the application inventory data of the agent:
1. Start SQLite and open the vulnerability database using the following command.
sqlite3 /var/ossec/queue/vulnerabilities/cve.db2. List the tables in the database using the following command.
sqlite>.tables
3. Retrieve the data in a table by running the following command.
select * from <table>;Alert generation
The Vulnerability Detector creates notifications whenever it discovers any vulnerabilities during the initial scan. It also notifies users when new vulnerabilities are detected or when existing vulnerabilities have been resolved.
Compatibility matrix
The following table shows the operating systems the Vulnerability Detector currently supports and the provider(s) needed for each distribution.
| Distribution | Versions | Provider |
|---|---|---|
| Windows | Windows XP and later | National Vulnerability Database MSU |
Scan types
Wazuh has three different types of scans.
The Vulnerability Detector has three scan types: Baseline, Full scan, and Partial scan. During the Baseline scan, it performs a full scan of the operating system and installed packages, creating a list of vulnerabilities. The Full scan is triggered periodically and checks for any changes in the vulnerability inventory. the Partial scan option only scans for new packages and updates in the CVE inventory.
A few considerations arise from this behavior:
- The “min_full_scan_interval” setting helps improve performance by controlling how often Full scans are run.
- Vulnerabilities in the agent’s inventory are either “VALID” (still present), “PENDING” (being confirmed during a scan), or “OBSOLETE” (no longer present).
Configuring and running scans
To configure vulnerability scans in Wazuh, the Vulnerability Detector module needs to be enabled and the scan settings be defined. By default, the Vulnerability Detector module is disabled on the Wazuh server, while the Wazuh agent has Syscollector enabled. Here are the steps to set up the vulnerability detection components:
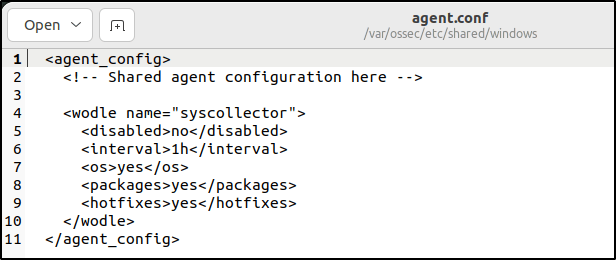
1. Add the following block of settings to the shared agent configuration file. The file is at /var/ossec/etc/shared/default/agent.conf on the Wazuh server. The agent ossec.conf configuration file can also be configured with these option :
<wodle name="syscollector">
   <disabled>no</disabled>
   <interval>1h</interval>
   <os>yes</os>
   <packages>yes</packages>
   <hotfixes>yes</hotfixes>
</wodle>
I configured instead the /var/ossec/etc/shared/windows/agent.conf where my Windows endpoint is a member of the windows group.
2. Enable the Vulnerability Detector module in the Wazuh server configuration file at /var/ossec/etc/ossec.conf. Set the value for the <enabled> tag to yes for the Vulnerability Detector module and every operating system you intend to scan. We have added a sample below:
<vulnerability-detector>
   <enabled>yes</enabled>
   <interval>5m</interval>
   <min_full_scan_interval>6h</min_full_scan_interval>
   <run_on_start>yes</run_on_start>

   <!-- Ubuntu OS vulnerabilities -->
   <provider name="canonical">
      <enabled>yes</enabled>
      <os>trusty</os>
      <os>xenial</os>
      <os>bionic</os>
      <os>focal</os>
      <os>jammy</os>
      <update_interval>1h</update_interval>
   </provider>

   <!-- Debian OS vulnerabilities -->
   <provider name="debian">
      <enabled>yes</enabled>
      <os>buster</os>
      <os>bullseye</os>
      <update_interval>1h</update_interval>
   </provider>

   <!-- RedHat OS vulnerabilities -->
   <provider name="redhat">
      <enabled>yes</enabled>
      <os>5</os>
      <os>6</os>
      <os>7</os>
      <os>8</os>
      <os>9</os>
      <update_interval>1h</update_interval>
   </provider>

   <!-- Amazon Linux OS vulnerabilities -->
   <provider name="alas">
      <enabled>yes</enabled>
      <os>amazon-linux</os>
      <os>amazon-linux-2</os>
      <update_interval>1h</update_interval>
   </provider>

   <!-- Arch OS vulnerabilities -->
   <provider name="arch">
      <enabled>yes</enabled>
      <update_interval>1h</update_interval>
   </provider>

   <!-- Windows OS vulnerabilities -->
   <provider name="msu">
      <enabled>yes</enabled>
      <update_interval>1h</update_interval>
   </provider>

   <!-- Aggregate vulnerabilities -->
   <provider name="nvd">
      <enabled>yes</enabled>
      <update_interval>1h</update_interval>
   </provider>
</vulnerability-detector>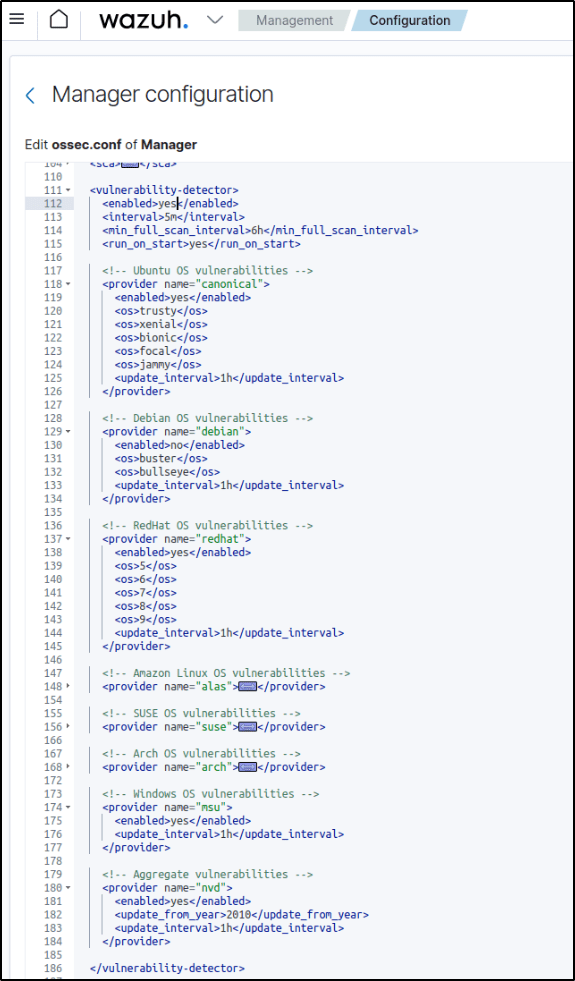
3. Restart the manager to apply the changes.
The Vulnerability Detector generates logs in the Wazuh server that trigger alerts. Every alert contains the following fields:
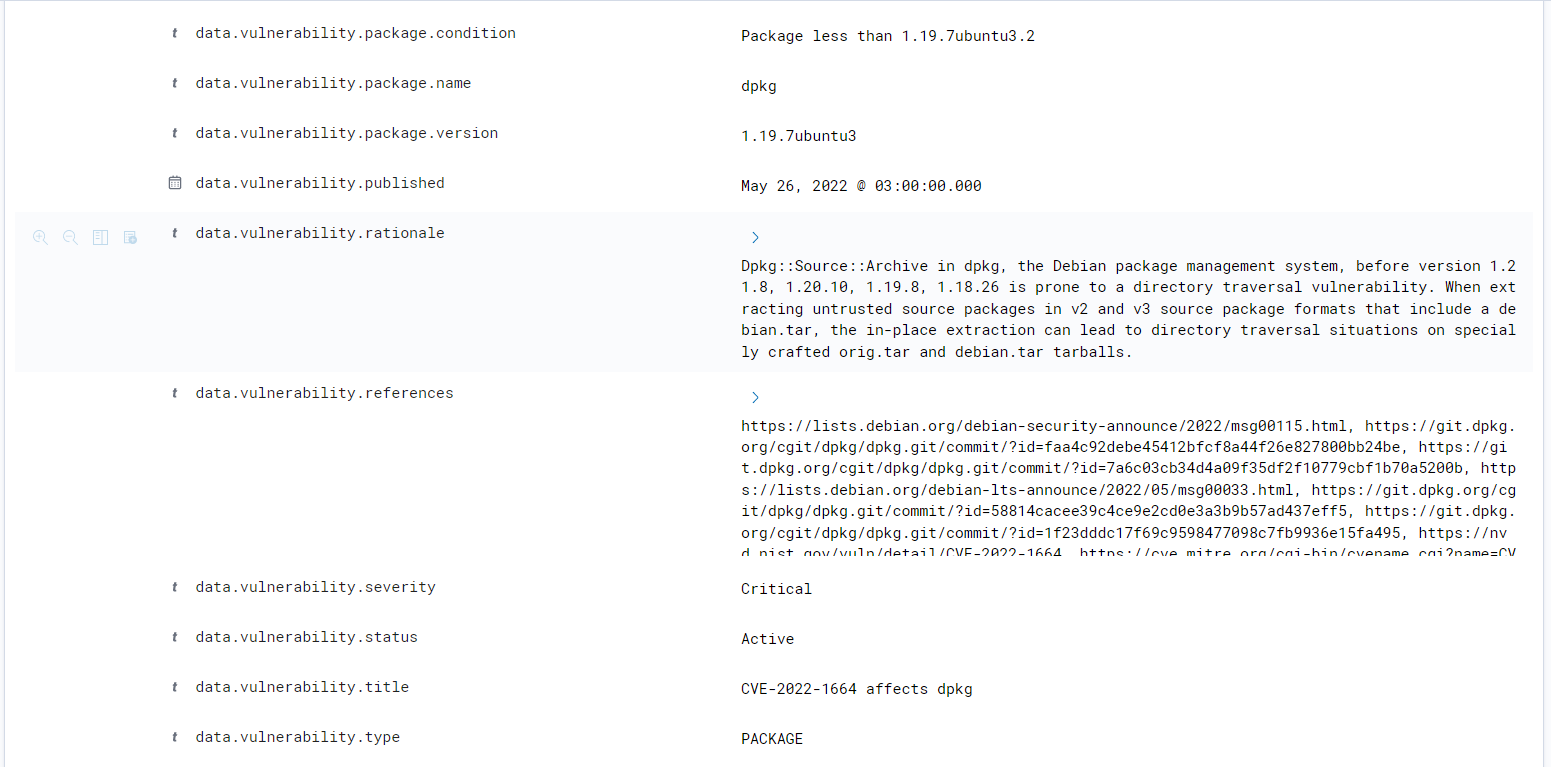
- CVE: The Common Vulnerabilities and Exposures identifier for the corresponding vulnerability.
- Title: Short description of the impact of the vulnerability.
- Rationale: Broad description of the vulnerability.
- Severity: Impact of the vulnerability in terms of security.
- Package: Information about the affected package, including why the package is marked as vulnerable.
- Published: Date when the feed added the vulnerability.
- Updated: Date of the last vulnerability update.
- CWE: The Common Weakness Enumeration reference.
- CVSS: Vulnerability assessment according to the Common Vulnerability Scoring System (versions 2 and 3).
- Advisories IDs: Red Hat security advisories.
- References: URLs with extra information on the vulnerability.
- Bugzilla references: Links to the references of the vulnerability in Bugzilla.
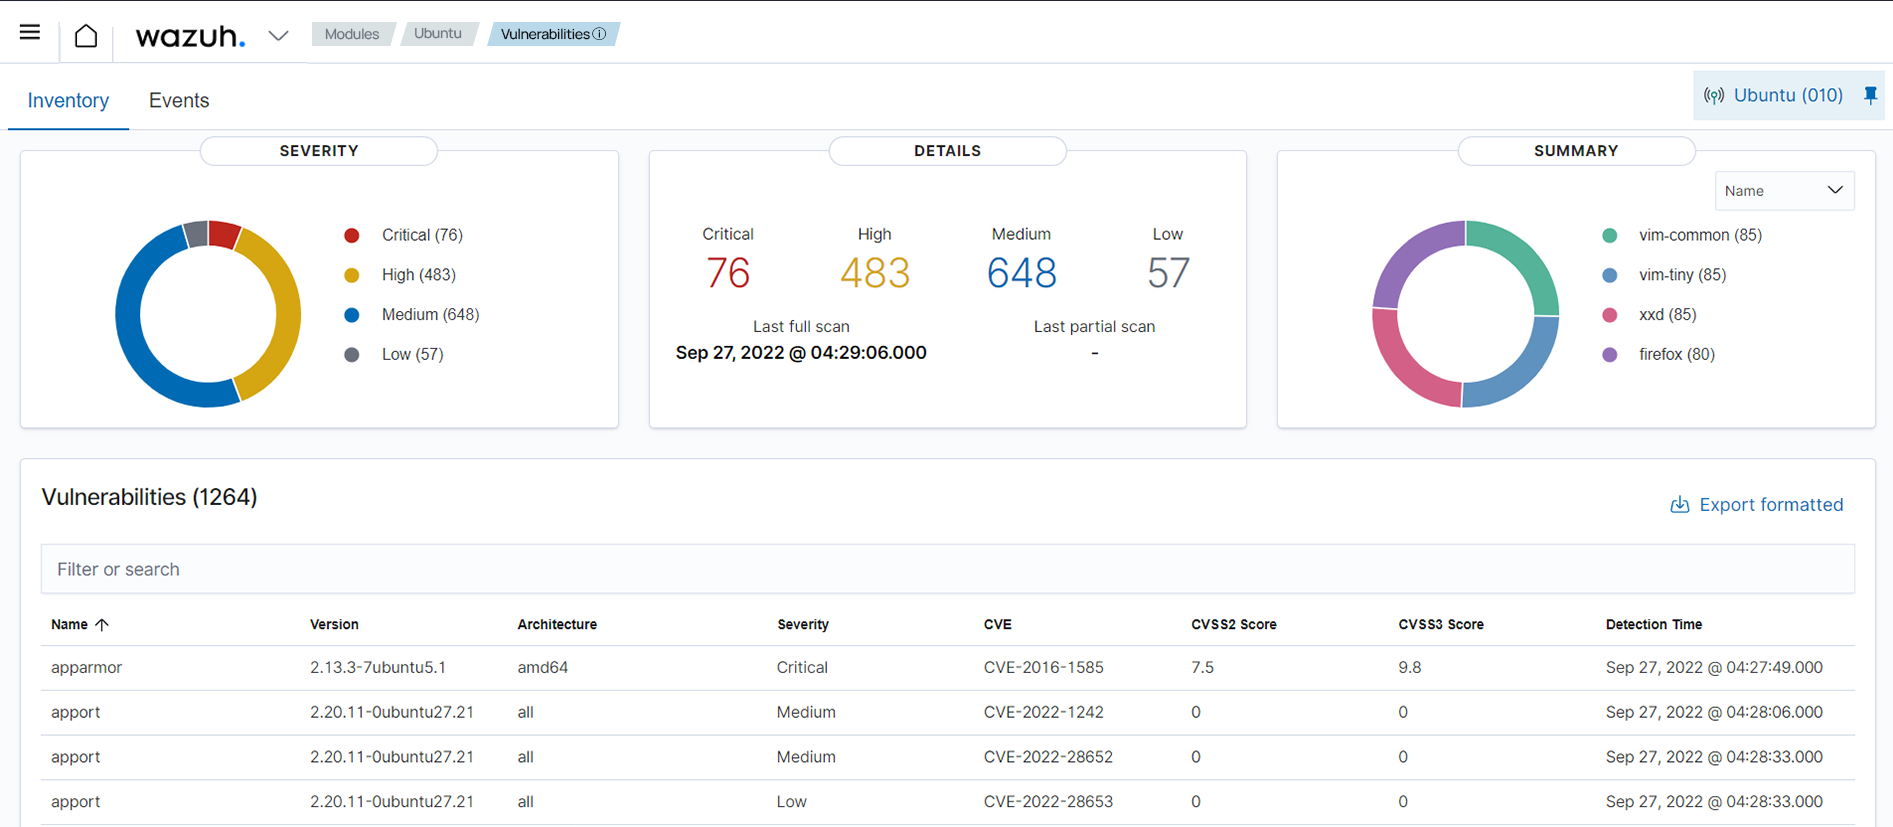
To see the inventory of potentially vulnerable packages on a particular agent, navigate to the Vulnerabilities module in the WUI and select the corresponding agent.
Below shows no vulnerabilities found.

Below is an excerpt from the documentation that shows an endpoint with detected vulnerabilities.
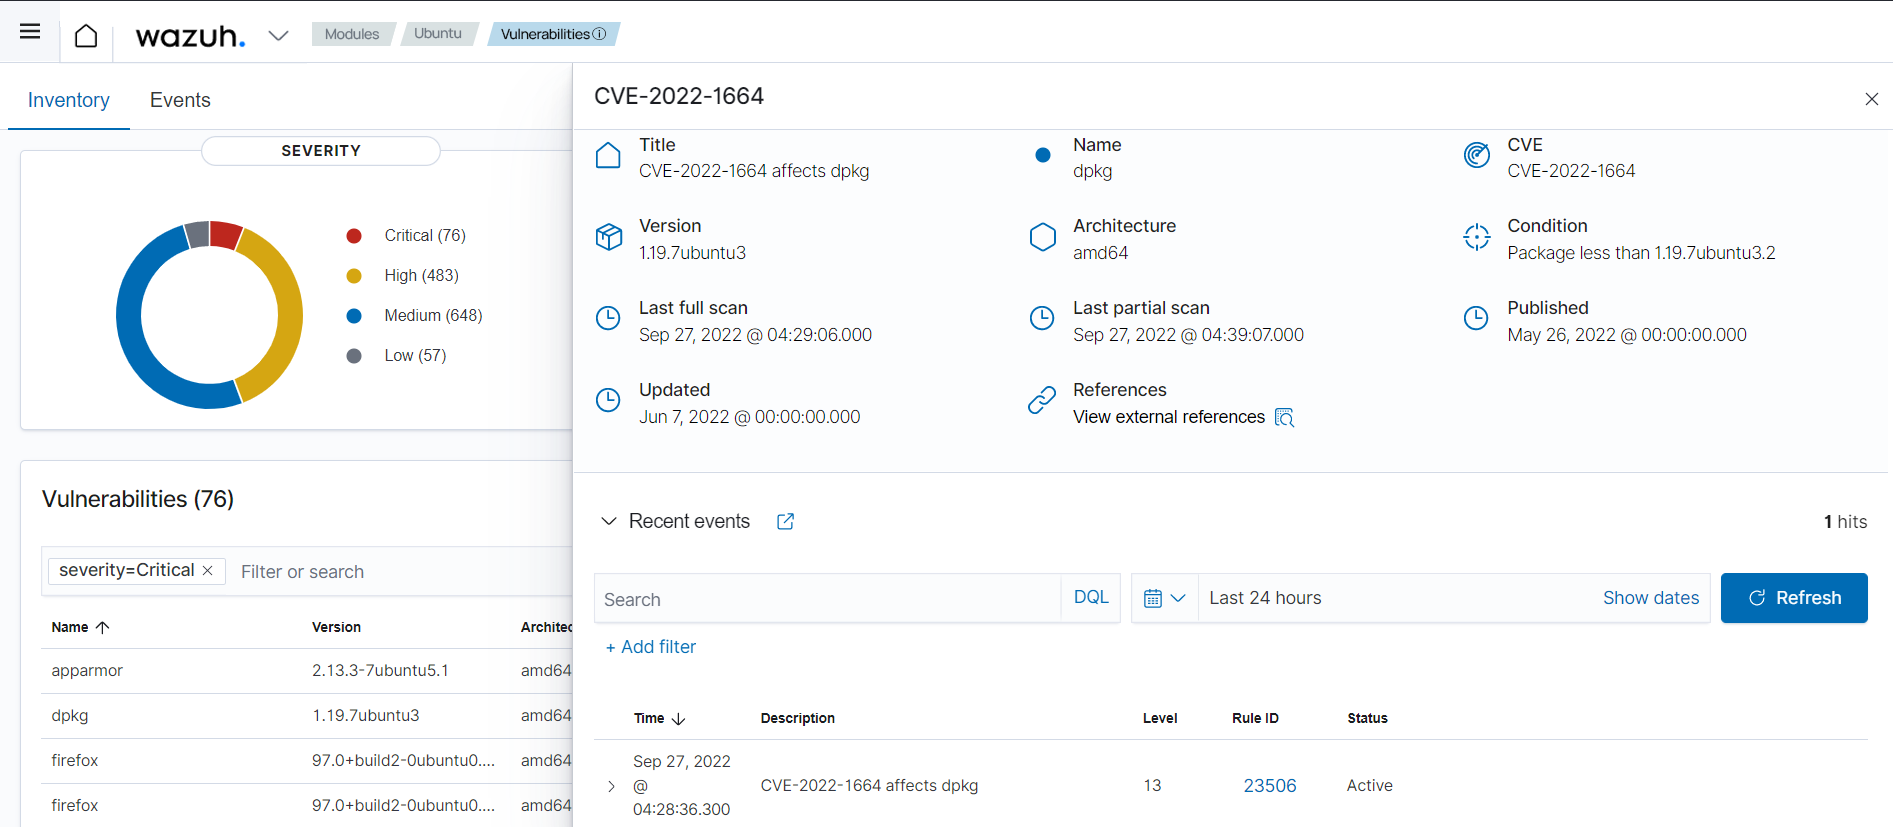
Here is an example of how the alert fields appear on the dashboard:
Querying the vulnerability database
The vulnerability database can be located in the /var/ossec/queue/vulnerabilities/cve.db directory on the Wazuh server. SQLite is used to query and interact with the database.
To search the vulnerability database using SQLite, follow these steps.
1. Start SQLite and open the vulnerability database using the following command:
sqlite3 /var/ossec/queue/vulnerabilities/cve.dbList the tables in the database using the following command:
.tables
Retrieve all the data in a table by running the following command:
SELECT * from <TABLE>;Replace <TABLE> with the name of the table.
Warning: Don’t make changes to the database. It can lead to issues when the Vulnerability Detector module is running a scan.

Use Case: Find all KBs that patch a specified CVE for Windows endpoints
In this scenario, the focus will be on the process of detecting any Windows Knowledge Base (KB) updates that tackle a specific vulnerability on Windows endpoints. This can be achieved by utilizing the Wazuh server and making use of SQLite.
1. Start SQLite and open the vulnerability database using the following command:
sqlite3 /var/ossec/queue/vulnerabilities/cve.db2. Run .mode line in the SQLite prompt to configure the SQLite output format.
3. Run the following command to view all the details of the chosen CVE and operating system:
SELECT * FROM msu WHERE cveid = "<CVE_ID>" AND PRODUCT LIKE "%<OS_IDENTIFIER>%";Where:
<OS_IDENTIFIER>is a string from the operating system name. It displays result for only the specified operating system.<CVE_ID>is the identifier for the CVE.
Example below:
SELECT * FROM msu WHERE cveid = "CVE-2023-21524" AND PRODUCT LIKE "%Server 2022%";
4. Run the command below to list all the KBs that patch KB5022291 replaces. This will be a list of patches that are no longer necessary to install once a user installs KB5022291.
SELECT patch FROM msu_supersedence WHERE super = "5022291";
5. Run the command below to get a list of all the patches that replaced KB5022291. This list contains all the patches that resolve the same vulnerabilities as KB5022291 when installed.
SELECT super FROM msu_supersedence WHERE patch = "5022291";
System inventory
Keeping track of hardware and software assets is crucial for ensuring security. In this section, I will explore how Wazuh scans endpoints to gather information about installed applications, active processes, network data, and other important system details.
Configuration
By default, the Wazuh agent activates the Syscollector module on all installed endpoints. The configuration for Syscollector can be changed in the Wazuh agent configuration file located at:
/var/ossec/etc/ossec.conffor Linux endpoints.C:\Program Files (x86)\ossec-agent\ossec.conffor Windows endpoints./Library/Ossec/ossec.conffor macOS endpoints.
The centralized configuration enables modifications to the Syscollector module on multiple monitored endpoints within a single agent group. In Wazuh, the configuration file for the default group can be found at /var/ossec/etc/shared/default/agent.conf on the server. Changes made in the centralized configuration will supersede the local agent configuration.
The following block represents the standard configuration for Syscollector, which is included in the Wazuh agent configuration file:
<!-- System inventory -->
   <wodle name="syscollector">
     <disabled>no</disabled>
     <interval>1h</interval>
     <scan_on_start>yes</scan_on_start>
     <hardware>yes</hardware>
     <os>yes</os>
     <network>yes</network>
     <packages>yes</packages>
     <ports all="no">yes</ports>
     <processes>yes</processes>

     <!-- Database synchronization settings -->
     <synchronization>
       <max_eps>10</max_eps>
     </synchronization>
   </wodle>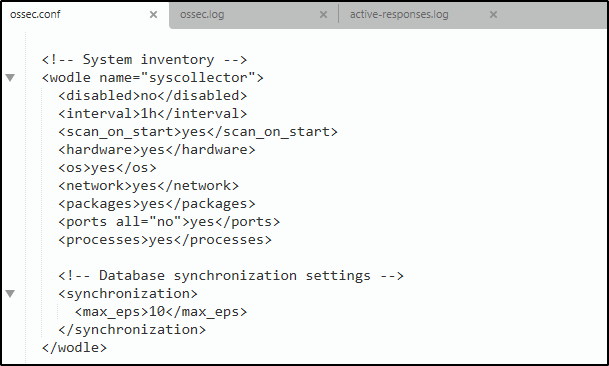
Where:
<disabled>specifies whether the Syscollector module is enabled or not. The default value isno. The allowed values areyesandno.<interval>specifies the time between system scans. The default value is 1 hour. The allowed value is a positive number that should contain a suffix character indicating a time unit, such ass(seconds),m(minutes),h(hours), andd(days).<scan_on_start>initiates a system scan immediately after you restart the Wazuh service on the endpoint. The default value isyes. The allowed values areyesandno.<hardware>option enables or disables the hardware information collection by Syscollector. The default value isyes. The allowed values areyesandno.<os>option enables or disables the operating system scan. The default value isyes. The allowed values areyesandno.<network>enables or disables the network scan. The default value isyes. The allowed values areyesandno.<packages>enables or disables the scanning of packages with a default value ofyes. The allowed values areyesandno.<ports all="no">enables or disables the port scan. The default value isyes. You can configure two allowed values ofyesandno. This option also accepts an additional parameterall, with which you can restrict the scan to only listening ports using<ports all="no">. If you want Syscollector to scan all ports, then you change the value toyes.<processes>enables or disables the scanning for running processes on a monitored endpoint. The default value ofyes. The allowed values areyesandno.<max_eps>allows you to set the maximum event reporting throughput. The default value is 10, which signifies 10 events per second. The allowed value is an Integer number between 0 and 1000000.
When modifying the configuration file, it is important to restart the agent.Saving the changes will enable the active-response feature and trigger a restart of the agent if the part about “Restarting the Wazuh agent with active response” is included in the implementation.
Viewing system inventory data
Wazuh dashboard
To access the inventory data of each monitored endpoint in the Wazuh dashboard, select an agent and go to the “Inventory data” tab. This tab will provide the information about the operating system, hardware, processes, network interface, and packages of the selected endpoint.

Query the agent inventory database
The Syscollector module conducts regular scans and transmits the updated data to the Wazuh server in JSON format. The information is then analyzed and stored in individual databases for each endpoint by the Wazuh server. These databases consist of tables that store various types of system data. By utilizing the Wazuh API or the SQLite tool, specific information can be retrieved from the database through queries.
Using SQLite
The database for each monitored endpoint is located on the Wazuh server at /var/ossec/queue/db/. Directly querying each database is possible. To establish a connection with an endpoint’s database, utilize the following command:
sqlite3 /var/ossec/queue/db/<AGENT_ID>.dbWhere <AGENT_ID> corresponds to the agent ID of the monitored endpoint.
Get the Ubuntu Agent ID with
sudo /var/ossec/bin/agent_control -l
Output:
SQLite version 3.7.17 2013-05-20 00:56:22
Enter ".help" for instructions
Enter SQL statements terminated with a ";"
sqlite>
After connecting to the database, query the list of tables in it using the command below:
sqlite>.tables
Generating system inventory reports
There are two categories of reports that can be generated on the Wazuh dashboard: the property-specific report and the endpoint inventory report.
Property-specific report
This functionality enables the exportation of CSV reports for a particular endpoint’s property. An example would be generating a report for the software installed on an endpoint. These reports are exclusively accessible for processes and installed software. To obtain the report, simply click on the Download CSV button located below the desired property on the Inventory data page of the endpoint.


Endpoint inventory report
This functionality enables the exporting of a comprehensive report encompassing all endpoint properties collected by the Wazuh Syscollector module. This report is generated in PDF format and can be utilized for various purposes. To obtain the complete endpoint report, follow these steps:
- Click on Generate Report on the Inventory data page of the Wazuh agent.

Using Syscollector information to trigger alerts
Note: This feature has been enabled again in Wazuh 4.4.
Users can establish guidelines to activate notifications based on the data collected by the Syscollector module. By designating the <decoded_as> field as syscollector in a guideline, relevant information can be displayed in the notification description. The Syscollector module employs event ID 221, and the default guideline level is set to 0, meaning it is not initially displayed on the Wazuh dashboard. To craft personalized guidelines that generate visible notifications on the dashboard, one can utilize the <if_sid>221</if_sid> tag. For instance, these personalized guidelines can trigger notifications whenever a port is opened, modified, or closed.
<group name="syscollector,">
  <!-- ports -->
  <rule id="100310" level="3" >
      <if_sid>221</if_sid>
      <field name="type">dbsync_ports</field>
      <description>Syscollector ports event.</description>
  </rule>

  <rule id="100311" level="3" >
      <if_sid>100310</if_sid>
      <field name="operation_type">INSERTED</field>
      <description>The port: $(port.local_port), with local ip: $(port.local_ip) has been opened. Syscollector creation event detected.</description>
  </rule>

  <rule id="100312" level="3" >
      <if_sid>100310</if_sid>
      <field name="operation_type">MODIFIED</field>
      <description>The port: $(port.local_port), with local ip: $(port.local_ip) has been modified. Syscollector modification event detected.</description>
  </rule>

  <rule id="100313" level="3" >
      <if_sid>100310</if_sid>
      <field name="operation_type">DELETED</field>
      <description>The port: $(port.local_port), with local ip: $(port.local_ip) has been closed. Syscollector deletion event detected.</description>
  </rule>
</group>
The Wazuh dashboard shows the alerts triggered when a port opening operation occurs.

Conclusion
Through this Wazuh blog series, I was able to test and experience a wide range of the platform’s security capabilities. I walked through installing Wazuh and deploying agents on Ubuntu and Windows systems. For threat detection, I leveraged file integrity monitoring to watch for unauthorized changes and configured custom rules to detect malware execution.
Integrating VirusTotal enabled automating malware analysis, while YARA rules allowed tailored detection policies. The rootcheck module uncovered hidden Linux processes indicative of rootkits. I also monitored system calls for insights into suspicious activity and privilege escalation attempts.
The vulnerability detector scanned for unpatched CVEs, while the system inventory tracker provided asset visibility. Sysmon integration boosted Windows logging, and osquery empowered endpoint queries.
While just an introduction, this hands-on Wazuh experience greatly enhanced my understanding of implementing robust endpoint security tools. I look forward to applying these learnings as I continue developing practical skills for security operations roles.
References
Thanks for reading. ‘Til next time 🙂

Leave a comment