
In my last post, I began demonstrating Wazuh’s security capabilities on an Ubuntu endpoint. I showed features like file integrity monitoring, and active response in action.
In this post, I continue to re-create and explore practical examples of Wazuh as a tool for monitoring docker events, integrating network-based IDS, detecting and removing malware, and many more.
I recognize that this is a lengthy post covering many Wazuh capabilities. However, my goal is to get hands-on experiences to demonstrate Wazuh’s versatility in addressing real-world security use cases.
Monitoring Docker events
Docker containers need ongoing monitoring to maintain security and compliance. This section will demonstrate using Wazuh to monitor Docker events, resource usage, and health on an Ubuntu host running containers. Tracking container activity is crucial for detecting potential threats.
The following steps should be completedbefore configurations can be made:
- Install the Wazuh agent on the Docker server. The Wazuh agent secures the underlying Docker infrastructure by monitoring the server where the Docker daemon is running.
- Enable the Wazuh Docker listener to monitor container activity. The Docker listener runs on the agent deployed on the Docker server to collect and forward Docker-related logs to the Wazuh server.
Enabling the Wazuh Docker listener
Steps to enable the Wazuh Docker listener dashboard:
- Click on the Wazuh menu icon, and select Settings > Modules.
- Scroll down to the Threat Detection and Response section and enable Docker listener.
- Click on the Wazuh menu icon, and select Modules > Docker listener to view the Docker listener dashboard
Enabling the Wazuh Docker listener


See the Monitoring container activity section of the documentation to learn more about monitoring Docker and the docker-listener module.
Configuring the Ubuntu Endpoint
Following are the steps taken to configure the Ubuntu endpoint to monitor Docker events.
1. Install Python and pip:
sudo apt install python3 python3-pip
2. Upgrade pip:
pip3 install --upgrade pip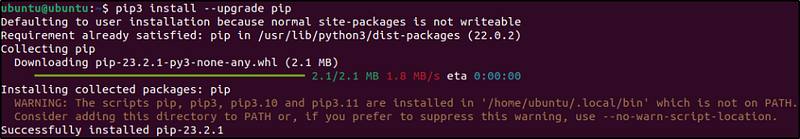
3. Install Docker and Python Docker Library:
curl -sSL https://get.docker.com/ | sh sudo pip3 install docker==4.2.0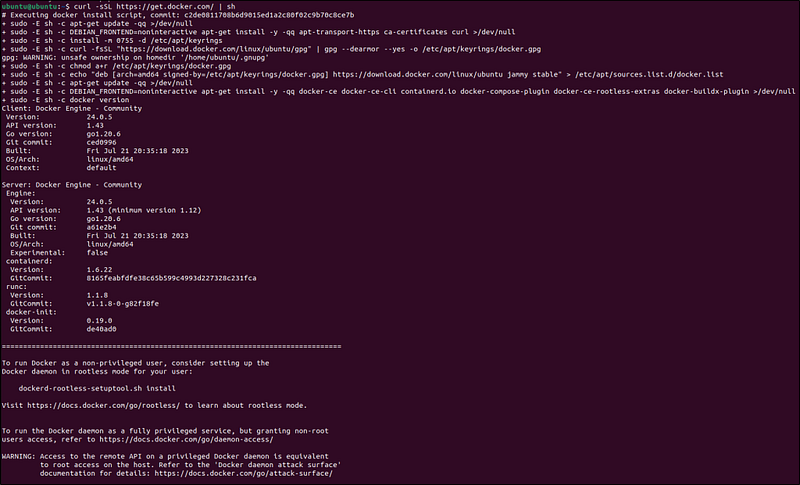
4. Edit the Wazuh agent configuration file /var/ossec/etc/ossec.conf and add this block to enable the docker-listener module:
<ossec_config>
  <wodle name="docker-listener">
    <interval>10m</interval>
    <attempts>5</attempts>
    <run_on_start>yes</run_on_start>
    <disabled>no</disabled>
  </wodle>
</ossec_config>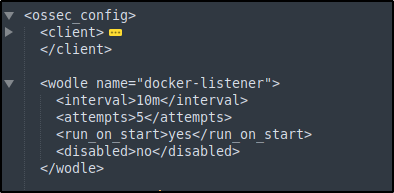
5. Enable the Wazuh agent to receive remote commands from the Wazuh server. By default, remote commands are disabled in agents for security reasons.
echo "logcollector.remote_commands=1" >> /var/ossec/etc/local_internal_options.conf
6. Restart the Wazuh agent to apply the changes.
Configuring the Wazuh Server
Following are the steps to configure the Wazuh server:
Note: Need to be a root user to execute all the commands described below.
1. Create a Wazuh agent group called container:
/var/ossec/bin/agent_groups -a -g container -q2. Obtain the ID of all Wazuh agents using the following command:
/var/ossec/bin/manage_agents -l
3. Assign the Wazuh agent hosting the Docker containers to the container group. Multiple agents can be assigned to the group. This ensures all agents running Docker containers in your environment receive the same configuration.
Replace <AGENT_ID> with the agent’s ID of the endpoint hosting the Docker container.
/var/ossec/bin/agent_groups -a -i <AGENT_ID> -g container -q
4. Add the following settings to the /var/ossec/etc/shared/container/agent.conf configuration file. This enables the Docker listener module and sets the commands to execute on the monitored endpoint for Docker container information gathering.
<agent_config>
  <!-- Configuration to enable Docker listener module. -->
  <wodle name="docker-listener">
    <interval>10m</interval>
    <attempts>5</attempts>
    <run_on_start>yes</run_on_start>
    <disabled>no</disabled>
   </wodle>

<!-- Command to extract container resources information. -->
  <localfile>
    <log_format>command</log_format>
    <command>docker stats --format "{{.Container}} {{.Name}} {{.CPUPerc}} {{.MemUsage}} {{.MemPerc}} {{.NetIO}}" --no-stream</command>
    <alias>docker container stats</alias>
    <frequency>120</frequency>
    <out_format>$(timestamp) $(hostname) docker-container-resource: $(log)</out_format>
  </localfile>
  <!-- Command to extract container health information. -->
  <localfile>
    <log_format>command</log_format>
    <command>docker ps --format "{{.Image}} {{.Names}} {{.Status}}"</command>
    <alias>docker container ps</alias>
    <frequency>120</frequency>
    <out_format>$(timestamp) $(hostname) docker-container-health: $(log)</out_format>
  </localfile>
</agent_config>
Note: The <frequency> tag defines how often the command will be run in seconds which can be configured to a value that suits an environment.
The commands to extract information configured above can get logs like in the following samples:
- Log for container resources:
Nov 2 14:11:38 ubuntu-2204 docker-container-resource: ossec: output: ‘docker container stats’: bbc95edda452 nginx-container 21.32% 3MiB / 1.931GiB 0.15% 1.44kB / 0B- Log for container health:
Nov 1 13:47:12 ubuntu-2204 docker-container-health: ossec: output: ‘docker container ps’: nginx nginx-container Up 48 minutes (healthy)5. Create a decoders file docker_decoders.xml in the /var/ossec/etc/decoders/ directory and add the following decoders to decode the logs received from the Wazuh agent:
<!-- Decoder for container resources information. -->
<decoder name="docker-container-resource">
  <program_name>^docker-container-resource</program_name>
</decoder>

<decoder name="docker-container-resource-child">
  <parent>docker-container-resource</parent>
  <prematch>ossec: output: 'docker container stats':</prematch>
  <regex>(\S+) (\S+) (\S+) (\S+) / (\S+) (\S+) (\S+) / (\S+)</regex>
  <order>container_id, container_name, container_cpu_usage, container_memory_usage, container_memory_limit, container_memory_perc, container_network_rx, container_network_tx</order>
</decoder>
<!-- Decoder for container health information. -->
<decoder name="docker-container-health">
  <program_name>^docker-container-health</program_name>
</decoder>
<decoder name="docker-container-health-child">
  <parent>docker-container-health</parent>
  <prematch>ossec: output: 'docker container ps':</prematch>
  <regex offset="after_prematch" type="pcre2">(\S+) (\S+) (.*?) \((.*?)\)</regex>
  <order>container_image, container_name, container_uptime, container_health_status</order>
</decoder>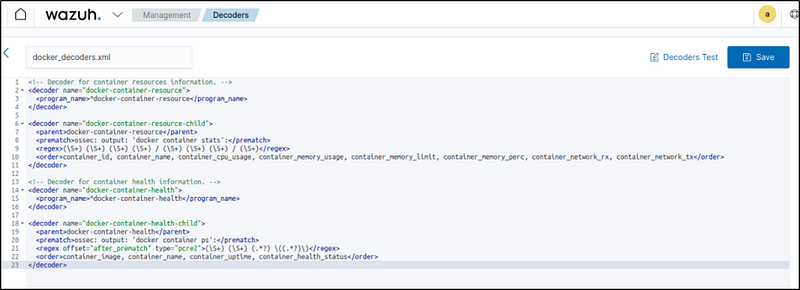
Note: The custom decoder file docker_decoders.xml might be removed during an upgrade. Back up the file before upgrading.
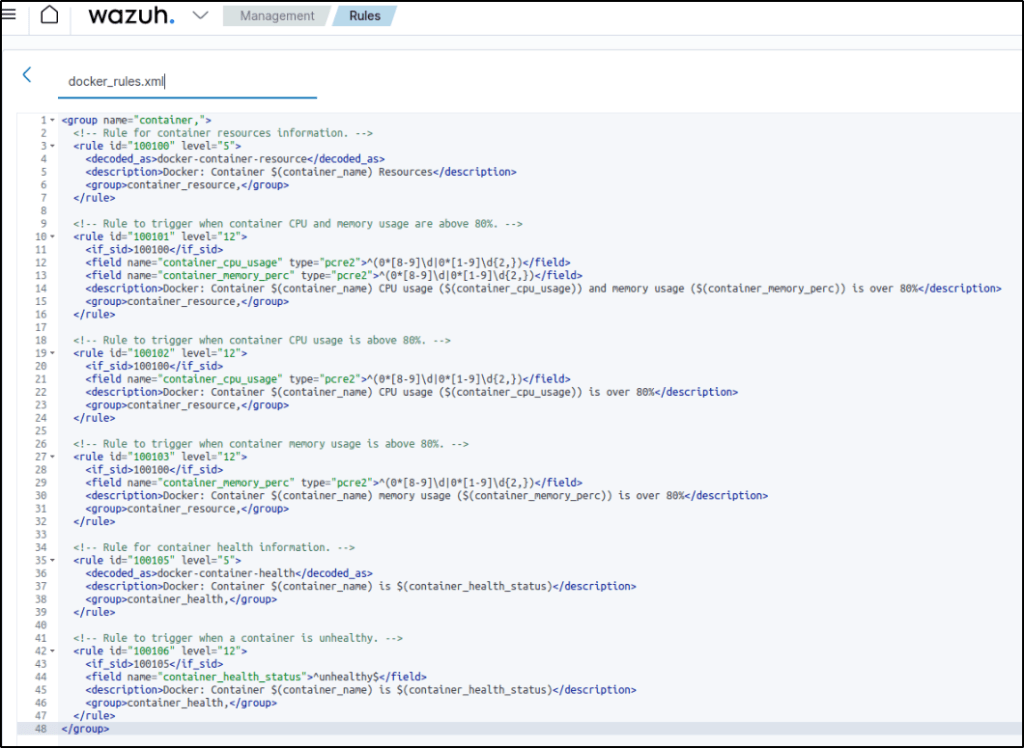
6. Create a rules file docker_rules.xml in the /var/ossec/etc/rules/ directory and add the following rules to alert the container information:
<group name="container,">
  <!-- Rule for container resources information. -->
  <rule id="100100" level="5">
    <decoded_as>docker-container-resource</decoded_as>
    <description>Docker: Container $(container_name) Resources</description>
    <group>container_resource,</group>
  </rule>

  <!-- Rule to trigger when container CPU and memory usage are above 80%. -->
  <rule id="100101" level="12">
    <if_sid>100100</if_sid>
    <field name="container_cpu_usage" type="pcre2">^(0*[8-9]\d|0*[1-9]\d{2,})</field>
    <field name="container_memory_perc" type="pcre2">^(0*[8-9]\d|0*[1-9]\d{2,})</field>
    <description>Docker: Container $(container_name) CPU usage ($(container_cpu_usage)) and memory usage ($(container_memory_perc)) is over 80%</description>
    <group>container_resource,</group>
  </rule>

<!-- Rule to trigger when container CPU usage is above 80%. -->
  <rule id="100102" level="12">
    <if_sid>100100</if_sid>
    <field name="container_cpu_usage" type="pcre2">^(0*[8-9]\d|0*[1-9]\d{2,})</field>
    <description>Docker: Container $(container_name) CPU usage ($(container_cpu_usage)) is over 80%</description>
    <group>container_resource,</group>
  </rule>

  <!-- Rule to trigger when container memory usage is above 80%. -->
  <rule id="100103" level="12">
    <if_sid>100100</if_sid>
    <field name="container_memory_perc" type="pcre2">^(0*[8-9]\d|0*[1-9]\d{2,})</field>
    <description>Docker: Container $(container_name) memory usage ($(container_memory_perc)) is over 80%</description>
    <group>container_resource,</group>
  </rule>
  <!-- Rule for container health information. -->
  <rule id="100105" level="5">
    <decoded_as>docker-container-health</decoded_as>
    <description>Docker: Container $(container_name) is $(container_health_status)</description>
    <group>container_health,</group>
  </rule>

  <!-- Rule to trigger when a container is unhealthy. -->
  <rule id="100106" level="12">
    <if_sid>100105</if_sid>
    <field name="container_health_status">^unhealthy$</field>
    <description>Docker: Container $(container_name) is $(container_health_status)</description>
    <group>container_health,</group>
  </rule>
</group>
Note: The custom rules file docker_rules.xml might be removed during an upgrade. Ensure to back up the file before performing upgrades.
7. Restart the Wazuh manager to apply the above changes: systemctl restart wazuh-manager
Testing the configuration- From Proof of concept
Perform several Docker activities like pulling a Docker image, starting an instance, running some other Docker commands, and then deleting the container.
1. Pull an image, such as the NGINX image, and run a container:
sudo docker pull nginx
sudo docker run -d -P --name nginx_container nginx
sudo docker exec -it nginx_container cat /etc/passwd
sudo docker exec -it nginx_container /bin/bash
exit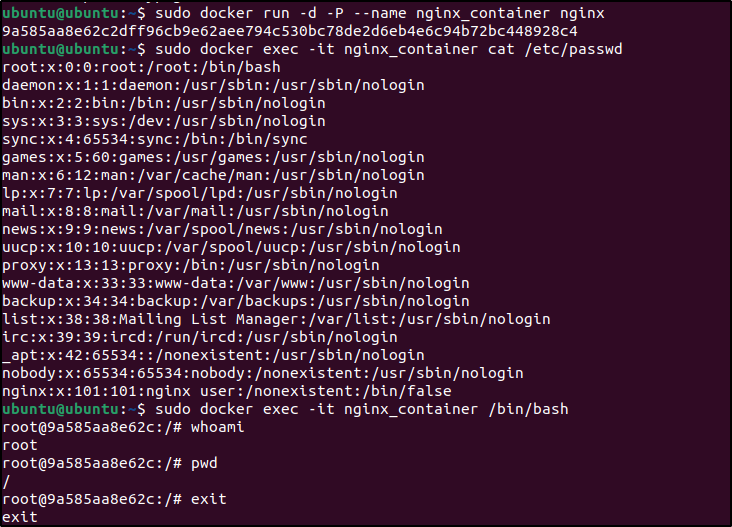
2. Stop and remove the container:
sudo docker stop nginx_containersudo docker rm nginx_container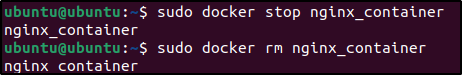
Visualize the alerts
The alert data can be visualized in the Wazuh dashboard. Add the filters in the search bar to query the alerts.
rule.groups: "docker"

Testing the configuration- From Blog: Docker container security monitoring with Wazuh
To showcase the use cases mentioned above, Nginx, Redis, and Postgres images are used to create a containerized environment on the monitored endpoint.
1. Create and switch into a project directory /container_env for the container environment using the following command:
mkdir container_env && cd $_2. Create a Docker compose file docker-compose.yml and add the following configurations to it.

version: '3.8'services:
db:
image: postgres
container_name: postgres-container
restart: always
environment:
- POSTGRES_USER=postgres
- POSTGRES_PASSWORD=postgres
healthcheck:
test: ["CMD-SHELL", "pg_isready"]
interval: 3m
timeout: 5s
retries: 1
ports:
- '8001:5432'
dns:
- 8.8.8.8
- 9.9.9.9
volumes:
- db:/var/lib/postgresql/data
networks:
- network
mem_limit: "512M" cache:
image: redis
container_name: redis-container
restart: always
healthcheck:
test: ["CMD", "redis-cli", "--raw", "incr", "ping"]
interval: 3m
timeout: 5s
retries: 1
ports:
- '8002:6379'
dns:
- 8.8.8.8
- 9.9.9.9
volumes:
- cache:/data
networks:
- network
mem_limit: "512M" nginx:
image: nginx
container_name: nginx-container
restart: always
healthcheck:
test: ["CMD-SHELL", "stat /etc/nginx/nginx.conf || exit 1"]
interval: 3m
timeout: 5s
retries: 1
ports:
- '8003:80'
- '4443:443'
dns:
- 8.8.8.8
- 9.9.9.9
networks:
- network
mem_limit: "512M"volumes:
db: {}
cache: {}
networks:
network:
The Docker compose file helps to manage multiple containers at once. The configuration performs the following Docker actions:
- Pulls Nginx, Redis, and Postgres container images from Docker Hub.
- Creates and starts
nginx-container,redis-container, andpostgres-containercontainers from the respective Docker images. - Creates and connects to a network called
container_env_network. - Creates and mounts volumes
container_env_dbandcontainer_env_cache. - Performs health checks on the created containers every three minutes.
3. Execute the following command in the path containing the docker-compose.yml file to create and start the containers:
sudo docker compose up -d
4. Use the stress-ng utility program to test for high CPU and memory utilization on one of the containers, for this example, the nginx-container.
- Execute the following commands to enter the container shell and install the stress-ng utility:
docker exec -it nginx-container /bin/bash

apt update && apt install stress-ng -y
- Execute the following command to trigger a high-level alert when both CPU and memory utilization exceeds 80%. The command runs for 3 minutes.
stress-ng -c 1 -l 80 -vm 1 --vm-bytes 500m -t 3m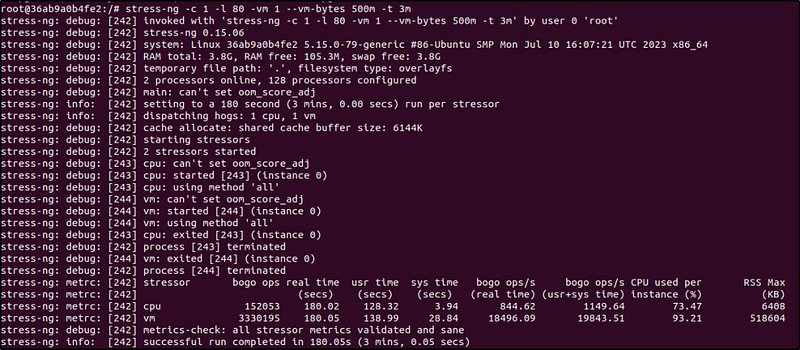
- Execute the following command to trigger a high-level alert when memory usage exceeds 80%. The command runs for 3 minutes.
stress-ng -vm 1 --vm-bytes 500m -t 3m
- Execute the following command to trigger a high-level alert when CPU usage exceeds 80%. The command runs for 3 minutes.
stress-ng -c 1 -l 80 -t 3m
5. The health check for the nginx-container verifies whether the configuration file /etc/nginx/nginx.conf exists. While inside the container shell, delete the configuration file to trigger a high-level alert when the container becomes unhealthy:rm /etc/nginx/nginx.conf
Alert visualization
Alert visualization
Visit the Wazuh dashboard for visualization of the alerts.
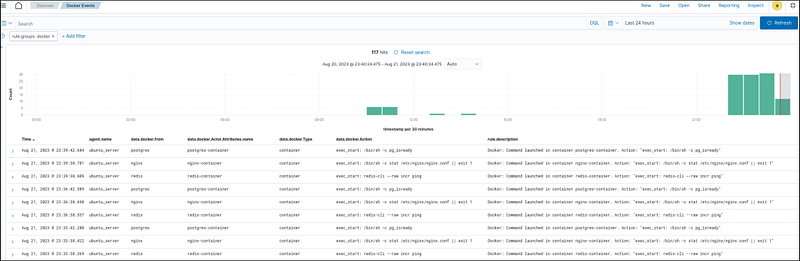
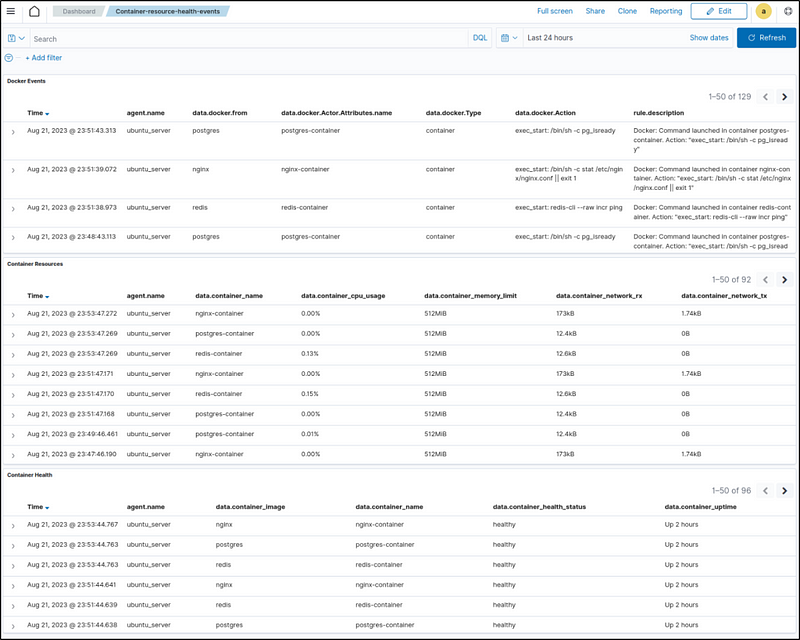
- Container actions alerts: Navigate to the Discover section and add the
rule.groups: dockerfilter in the search bar to query the alerts.Also, use the Filter by type search field and apply theagent.name,data.docker.from,data.docker.Actor.Attributes.name,data.docker.Type,data.docker.Action, andrule.description, filters. Save the query as Docker Events.

- This filter displays only Docker events with added columns to provide clearer info about the events.
- Below is a short clip from the documentation on how to apply the fields.
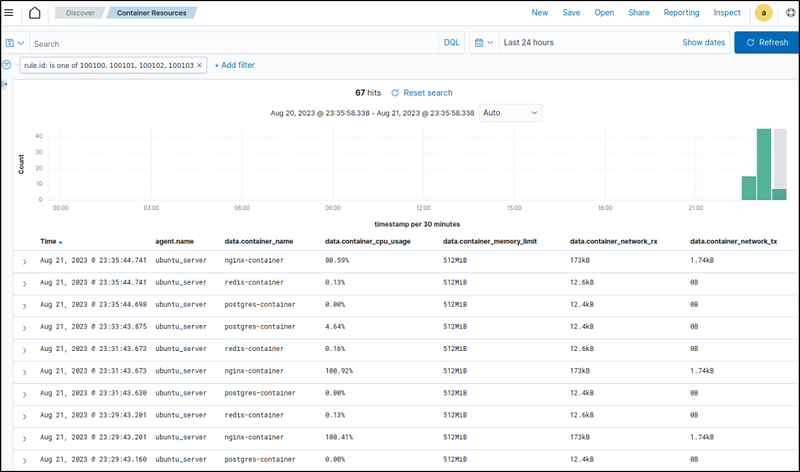
- Container resources alerts: Navigate to the Discover section and add the
rule.id: (100100 OR 100101 OR 100102 OR 100103)filter in the search bar to query the alerts. Also, use the Filter by type search field and apply theagent.name,data.container_name,data.container_cpu_usage,data.container_memory_usage,data.container_memory_limit,data.container_network_rx, anddata.container_network_txfilters. Save the query as Container Resources. - It can be seen which container generated alerts when the CPU usage is above 80%.
- Container health alerts: Navigate to the Discover section and add the
rule.id: (100105 OR 100106)filter in the search bar to query the alerts. Also, use the Filter by type search field and apply theagent.name,data.container_image,data.container_name,data.container_health_status, anddata.container_uptimefilters to show the status information. Save the query as Container Health. - This displays the health information of the containers.

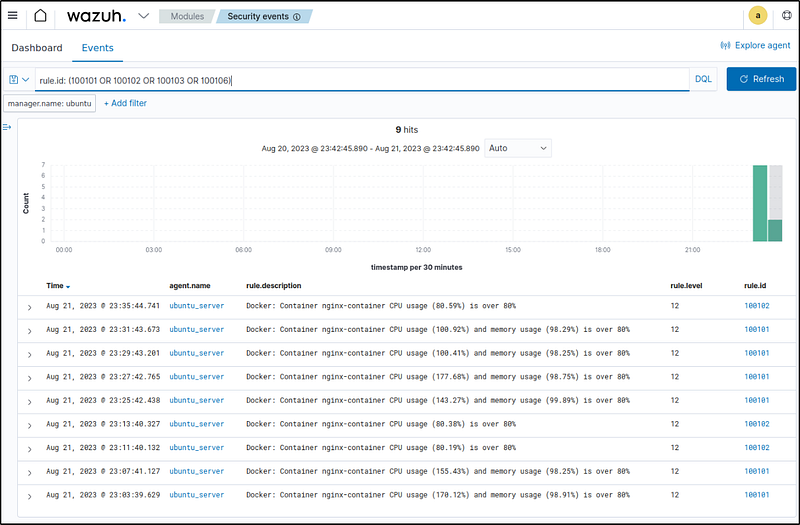
- Container threshold events: Navigate to the Wazuh > Security events section and add the
rule.id: (100101 OR 100102 OR 100103 OR 100106)filter in the search bar to query the alerts. - In this example, nginx container was being attacked. The image displays the alerts generated when the thresholds for CPU, Memory, and CPU and memory usages were breached, which was at 80%.
To have a single display of the visualizations, create a custom dashboard with the above templates. Navigate to OpenSearch Dashboards > Dashboard > Create New Dashboard, then select Add an existing link and click the saved visualizations (Docker Events, Container Resources, and Container Health). This will add the visualizations to the new dashboard. Save the dashboard as Container-resource-health-events.
- Below is a short clip from the documentation on how to create a custom dashboard with the visualizations created above.

Conclusion
Docker containers need continuous monitoring to maintain security and performance. By tracking container events, resource usage, and health status, issues can be rapidly detected and addressed to minimize disruption.
Wazuh provides visibility into container activity and metrics to spot abnormalities. This allows organizations to identify and respond to container security incidents and performance problems early.
In this section, I leveraged Wazuh to monitor critical Docker areas like container events, resource utilization, and health.
Network IDS integration
Network traffic monitoring provides valuable visibility into threats. I’ll integrate the Suricata IDS with Wazuh to combine network and endpoint detection capabilities. The integration allows correlating insights from Suricata’s traffic analysis with endpoint security events.
Configuring the Ubuntu endpoint
Following are the steps to configure Suricata on the Ubuntu endpoint and send the generated logs to the Wazuh server.
- Install Suricata on the Ubuntu endpoint. We tested this process with version 6.0.8 and it can take some time:
sudo add-apt-repository ppa:oisf/suricata-stable
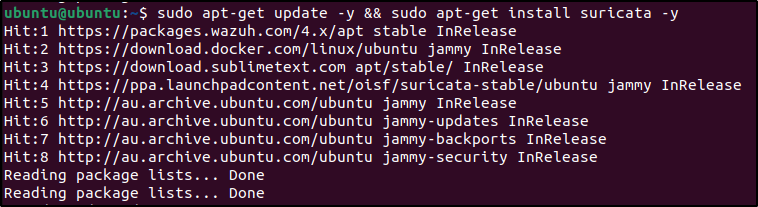
sudo apt-get update -y && sudo apt-get install suricata -y
2. Download and extract the Emerging Threats Suricata ruleset:
cd /tmp/ && curl -LO https://rules.emergingthreats.net/open/suricata-6.0.8/emerging.rules.tar.gz
sudo tar -xvzf emerging.rules.tar.gz && sudo mv rules /etc/suricata/
sudo chmod 640 /etc/suricata/rules/*.rules
Modified this command sudo tar -xvzf emerging.rules.tar.gz && sudo mv rules/*.rules /etc/suricata/rules/ because the directory rules need to be created first. So the set of commands would look like these.
cd /tmp/ && curl -LO https://rules.emergingthreats.net/open/suricata-6.0.8/emerging.rules.tar.gzsudo mkdir /etc/suricata/rulessudo tar -xvzf emerging.rules.tar.gz && sudo mv rules /etc/suricata/rules/sudo chmod 640 /etc/suricata/rules/*.rules


The chmod 640 means:
- (U)ser / owner can read, can write and can’t execute.
- (G)roup can read, can’t write and can’t execute.
- (O)thers can’t read, can’t write and can’t execute.
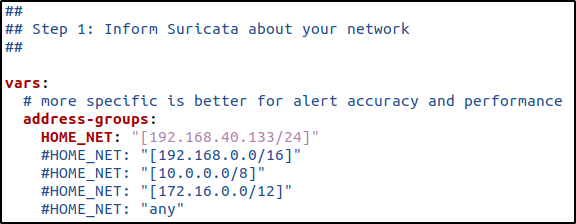
3. Modify Suricata settings in the /etc/suricata/suricata.yaml file and set the following variables:
EXTERNAL_NET: “any”
HOME_NET: "<UBUNTU_IP>"
EXTERNAL_NET: "any"

default-rule-path: /etc/suricata/rules
rule-files:
- "*.rules"
# Global stats configuration
stats:
enabled: no
# Linux high speed capture support
af-packet:
  - interface: enp0s3
Note: I did not change Global stats configuration because I was having issues with Suricata with the suggested changes as seen in the image below.

make a backup of the config file.

I used gedit to open the file and made the changes.
- Designated the “HOME_NET” with my Ubuntu’s local-host only IP address.
- I maintained the default path for the rules and added the path where the downloaded Suricata rules are located.

- This setting would allow Suricata to run in IPS mode in the configured interface.

- Suricata supports cross-platform packet capture using the libpcap library.
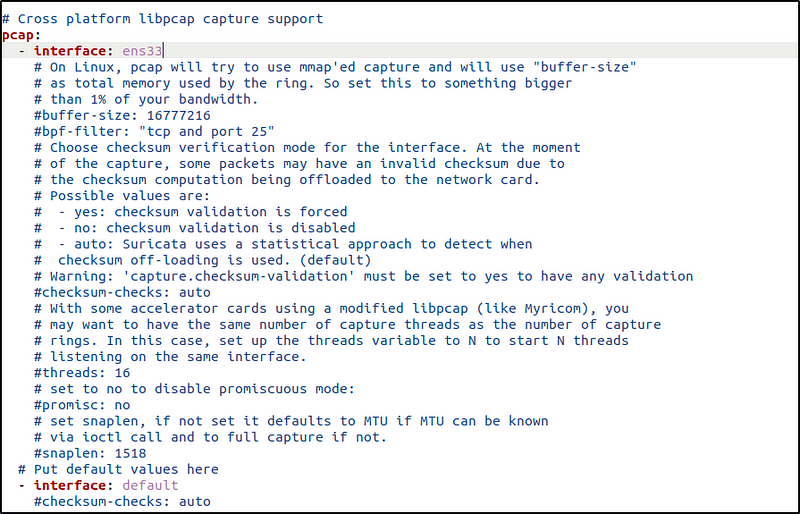

interface represents the network interface to be monitored. Replace the value with the interface name of the Ubuntu endpoint. For example, the Ubuntu’s interface to be monitored is enp0s3.
4. Restart the Suricata service:
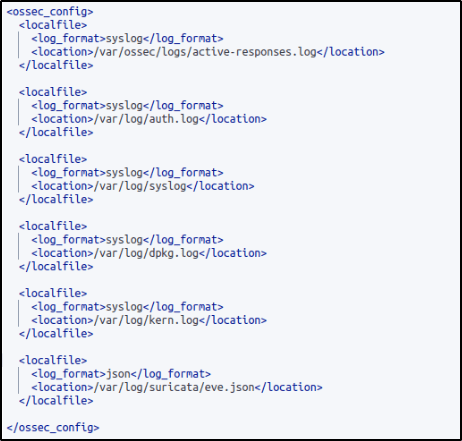
sudo systemctl restart suricata5. Add the following configuration to the /var/ossec/etc/ossec.conf file of the Wazuh agent. This allows the Wazuh agent to read the Suricata logs file:
<ossec_config>
  <localfile>
    <log_format>json</log_format>
    <location>/var/log/suricata/eve.json</location>
  </localfile>
</ossec_config>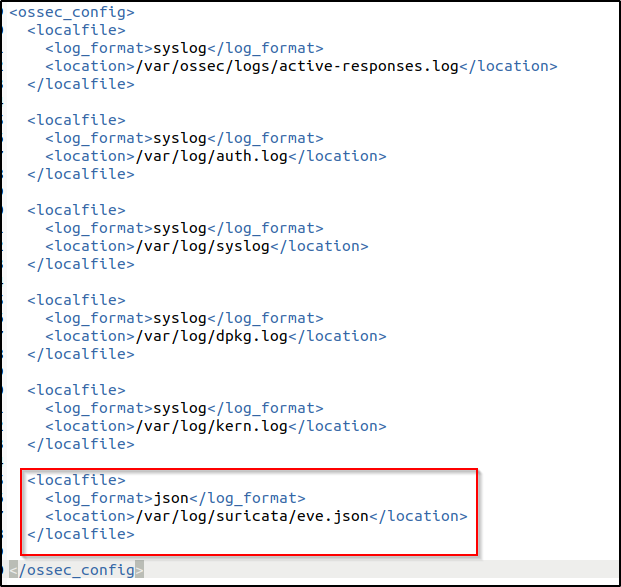
also in the server configuration
5. Restart the Wazuh agent to apply the changes
Attack emulation
Wazuh automatically parses data from /var/log/suricata/eve.json and generates related alerts on the Wazuh dashboard.
I pinged the Ubuntu endpoint from my Kali Linux machine:
ping -c 20 "<UBUNTU_IP>"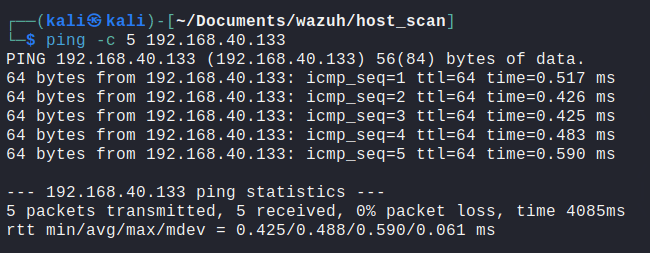
I also used the script I used in my Snort home lab, to ping live hosts and then perform Nmap scan to identify open ports.
The script is found here.

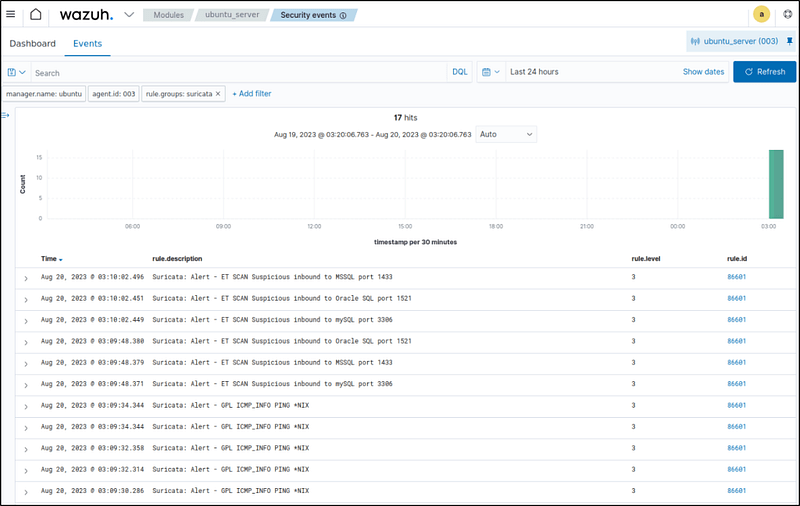
Visualize the alerts
Added filter below to see events related to Suricata alerts only.
rule.groups:suricata

The script when executed, generated the following alerts where the icmp echo requests and host scanning were detected.
Conclusion
Integrating an intrusion detection system (IDS) like Suricata with Wazuh expands monitoring coverage and detection capabilities. Suricata analyzes network traffic flows to identify threats like malware command and control, network scanning, and denial of service attacks.
By forwarding Suricata alerts to Wazuh, network-based threats can be correlated with endpoint security events.
I configured Suricata on my network and set up the Wazuh integration to ingest alerts. With network visibility combined with endpoint data, I have a more complete picture of potential security issues
Detecting an SQL injection attack
SQL injection remains a dangerous web application vulnerability. By sending malicious SQL code in input fields, attackers can access and extract data from database servers.
Wazuh can detect SQL injection attack patterns by analyzing web server logs that contain patterns like select, union, and other common SQL injection patterns.
This section will simulate an SQL injection attack on Ubuntu and show how Wazuh can detect it and generate alerts on the malicious input strings intended to exploit the database.
Configuring the Ubuntu endpoint
The following steps were performed to install Apache and configure the Wazuh agent to monitor the Apache logs. I have already installed Apache and configured the Ubuntu agent in my previous blog under “Blocking a known malicious actor” section.
1. Update the local packages and install the Apache web server:
sudo apt update sudo apt install apache2If the firewall is enabled, modify it to allow external access to web ports. Skip this step if the firewall is disabled.
sudo ufw app list
sudo ufw allow 'Apache'
sudo ufw status
2. Check the status of the Apache service to verify that the web server is running:
sudo systemctl status apache2
3. Use the curl command or open http://<UBUNTU_IP> in a browser to view the Apache landing page and verify the installation:
curl http://<UBUNTU_IP>4. Add the following lines to the Wazuh agent /var/ossec/etc/ossec.conf file. This allows the Wazuh agent to monitor the access logs of your Apache server:
<ossec_config>
  <localfile>
    <log_format>apache</log_format>
    <location>/var/log/apache2/access.log</location>
  </localfile>
</ossec_config>
5. Restart the Wazuh agent to apply the configuration changes.
Attack emulation
Replace <UBUNTU_IP> with the appropriate IP address and execute the following command from the attacker endpoint:
curl -XGET "http://<UBUNTU_IP>/users/?id=SELECT+*+FROM+users";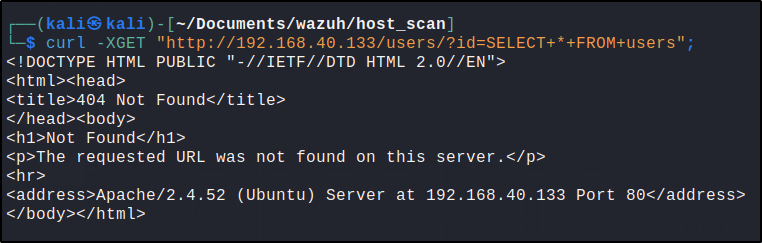
The expected result here is an alert with rule ID 31103 but a successful SQL injection attempt generates an alert with rule ID 31106.
Visualize the alerts
The attack was detected by the built-in rule and generated an alert with the following rule id.
rule.id:31103
Also seen in the image below is an alert that was generated by Suricata which displays a possible SQLinjection.


rule.id:31103 or rule.id:31106
Conclusion
I configured a Wazuh rule to detect a common SQL injection attack pattern “select” by analyzing web server logs on my Ubuntu host. When I simulated an attack by sending a test injection string to a vulnerable page, Wazuh immediately alerted on the malicious input found in the logs.
Detecting and blocking SQL injection is crucial for any web application. Wazuh provides out-of-the-box capabilities for finding these patterns within logs and alerting security teams to investigate.
Detecting suspicious binaries
Attackers often use malicious binaries to carry out exploits on systems. Wazuh has anomaly detection capabilities that identify suspicious executables on endpoints that may indicate malicious activity. Rootcheck also uncovers hidden processes, ports, and files.
Configuring the Ubuntu endpoint
The following are the steps taken to configure the Ubuntu endpoint to enable the Wazuh rootcheck module and perform anomaly and malware detection.
1. By default, the Wazuh rootcheck module is enabled in the Wazuh agent configuration file. Check the <rootcheck> block in the /var/ossec/etc/ossec.conf configuration file of the monitored endpoint and make sure that it has the configuration below
<rootcheck>
    <disabled>no</disabled>
    <check_files>yes</check_files>
<!-- Line for trojans detection -->
    <check_trojans>yes</check_trojans>
    <check_dev>yes</check_dev>
    <check_sys>yes</check_sys>
    <check_pids>yes</check_pids>
    <check_ports>yes</check_ports>
    <check_if>yes</check_if>
    <!-- Frequency that rootcheck is executed - every 12 hours -->
    <frequency>43200</frequency>
    <rootkit_files>/var/ossec/etc/shared/rootkit_files.txt</rootkit_files>
    <rootkit_trojans>/var/ossec/etc/shared/rootkit_trojans.txt</rootkit_trojans>
    <skip_nfs>yes</skip_nfs>
</rootcheck>
The rootcheck section explains the options in the rootcheck module.
2. Configure options for Rootcheck
Use the rootkit_files.txt to specify known file paths to files used by rootkits. Rootcheck scans these filepaths and generates alerts whenever it detects any of these files. Multiple entries can be added to the file and each entry must be in the following format:
# This is a comment
file_path ! Rootkit_Name ::
The example below detects Reptile rootkit:
#Reptile
reptile/reptile_cmd         ! Reptile rootkit ::
reptile/reptile_rc          ! Reptile rootkit ::
reptile/reptile_shell       ! Reptile rootkit ::
reptile/reptile_start       ! Reptile rootkit ::
lib/udev/reptile            ! Reptile rootkit ::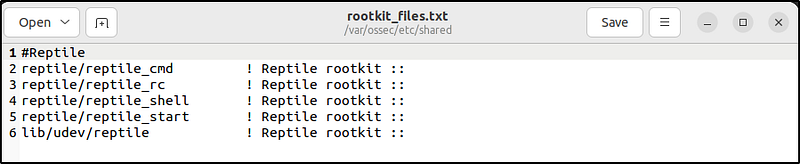
The rootkit_trojans.txt contains signatures of files that rootkits have trojaned. Rootcheck scans the files in this database for specified strings and generates alerts when there is a match. The signatures must be in the following format:
# This is a comment
file_name !string_to_search!Description
The example below detects trojan versions of common Linux binaries:
# Common binaries and public trojan entries
ls          !bash|^/bin/sh|dev/[^clu]|\.tmp/lsfile|duarawkz|/prof|/security|file\.h!
env         !bash|^/bin/sh|file\.h|proc\.h|/dev/|^/bin/.*sh!
echo        !bash|^/bin/sh|file\.h|proc\.h|/dev/[^cl]|^/bin/.*sh!
chown       !bash|^/bin/sh|file\.h|proc\.h|/dev/[^cl]|^/bin/.*sh!
chmod       !bash|^/bin/sh|file\.h|proc\.h|/dev/[^cl]|^/bin/.*sh!
chgrp       !bash|^/bin/sh|file\.h|proc\.h|/dev/[^cl]|^/bin/.*sh!
cat         !bash|^/bin/sh|file\.h|proc\.h|/dev/[^cl]|^/bin/.*sh!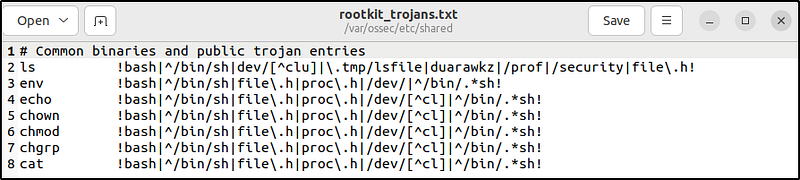
3. Restart the Wazuh agent to apply the changes:
Attack emulation
1. Create a copy of the original system binary:
sudo cp -p /usr/bin/w /usr/bin/w.copy2. Replace the original system binary /usr/bin/w with the following shell script:
sudo tee /usr/bin/w << EOF
#!/bin/bash
echo "`date` this is evil" > /tmp/trojan_created_file
echo 'test for /usr/bin/w trojaned file' >> /tmp/trojan_created_file
#Now running original binary
/usr/bin/w.copy
EOF
The rootcheck scan runs every 12 hours by default. Force a scan by restarting the Wazuh agent to see the relevant alert.
3. Force a scan by restarting the Wazuh agent to see the relevant alert.
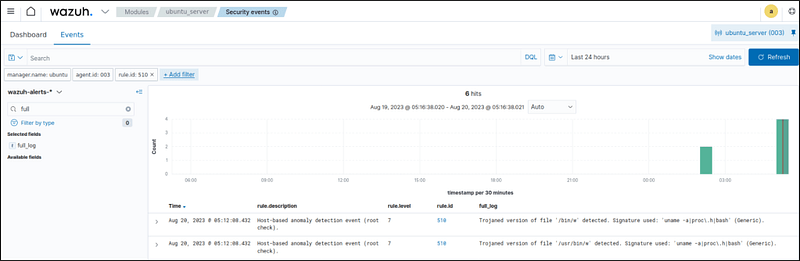
Visualize the alerts
The events can be filtered with the following to display detected suspicious binaries:
location:rootcheck AND rule.id:510 AND data.title:Trojaned version of file detected.

- Expanding on of the events would display more information about that particular event.
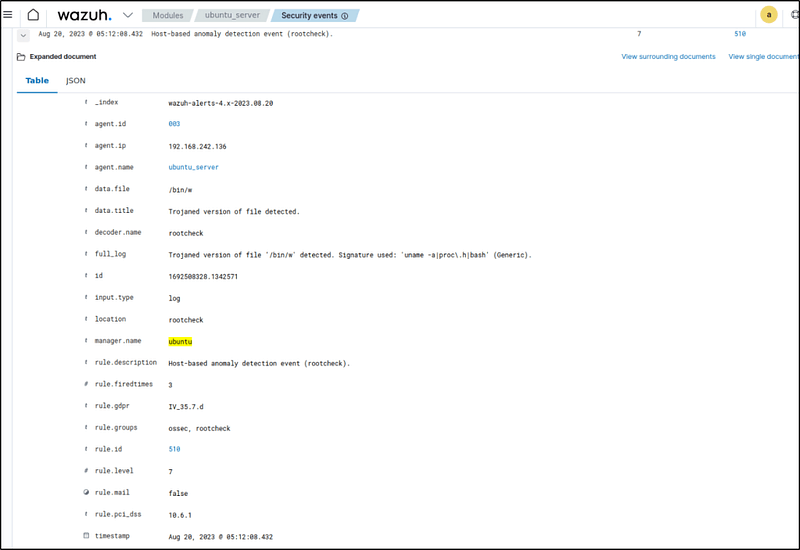
- Additionally, using the Filter by type search field, apply the
full_logfilter.
Conclusion
I demonstrated how Wazuh can detec suspicious binaries by replacing a legitimate system binary on my Ubuntu machine with a trojaned version containing malware. Even though it was disguised, Wazuh detected the execution of the dubious binary using the rootcheck security scanner to find abnormal processes.
By flagging unknown or altered binaries, Wazuh can stop attacks from tools that evade traditional signature-based detections
Detecting and removing malware using VirusTotal integration
Wazuh uses the integrator module to connect to external APIs and alerting tools such as VirusTotal in tandem with the File Integrity Monitoring (FIM) module to monitor a directory for changes to scan files for malware.
This demonstration needs a VirusTotal API key in this use case to authenticate Wazuh to the VirusTotal API.
For more information on this integration, check the VirusTotal integration section of the documentation.
An active response script is configured to remove files flagged as malicious by VirusTotal.
Configuring the Ubuntu endpoint
The /root directory of the Ubuntu endpoint is the directory set to be monitored in this exercise. These steps install the necessary packages and create the active response script that removes malicious files.
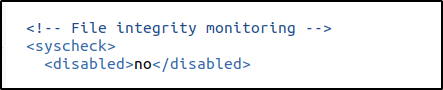
1. Enable the FIM to monitor for directory changes in the /root directory. Within the <syscheck> block in the Wazuh agent configuration file, make sure that <disabled> is set to no.
2. Add an entry within the <syscheck> block to configure a directory to be monitored in near real-time. In this case, you are monitoring the /root directory:
<directories realtime="yes">/root</directories>
3. Install jq, a utility that processes JSON input from the active response script.
sudo apt update && sudo apt -y install jq
4. Create the /var/ossec/active-response/bin/remove-threat.sh active response script to remove malicious files from the endpoint:
#!/bin/bash
LOCAL=`dirname $0`;
cd $LOCAL
cd ../
PWD=`pwd`
read INPUT_JSON
FILENAME=$(echo $INPUT_JSON | jq -r .parameters.alert.data.virustotal.source.file)
COMMAND=$(echo $INPUT_JSON | jq -r .command)
LOG_FILE="${PWD}/../logs/active-responses.log"
#------------------------ Analyze command -------------------------#
if [ ${COMMAND} = "add" ]
then
 # Send control message to execd
 printf '{"version":1,"origin":{"name":"remove-threat","module":"active-response"},"command":"check_keys", "parameters":{"keys":[]}}\n'
 read RESPONSE
 COMMAND2=$(echo $RESPONSE | jq -r .command)
 if [ ${COMMAND2} != "continue" ]
 then
  echo "`date '+%Y/%m/%d %H:%M:%S'` $0: $INPUT_JSON Remove threat active response aborted" >> ${LOG_FILE}
  exit 0;
 fi
fi
# Removing file
rm -f $FILENAME
if [ $? -eq 0 ]; then
 echo "`date '+%Y/%m/%d %H:%M:%S'` $0: $INPUT_JSON Successfully removed threat" >> ${LOG_FILE}
else
 echo "`date '+%Y/%m/%d %H:%M:%S'` $0: $INPUT_JSON Error removing threat" >> ${LOG_FILE}
fi
exit 0;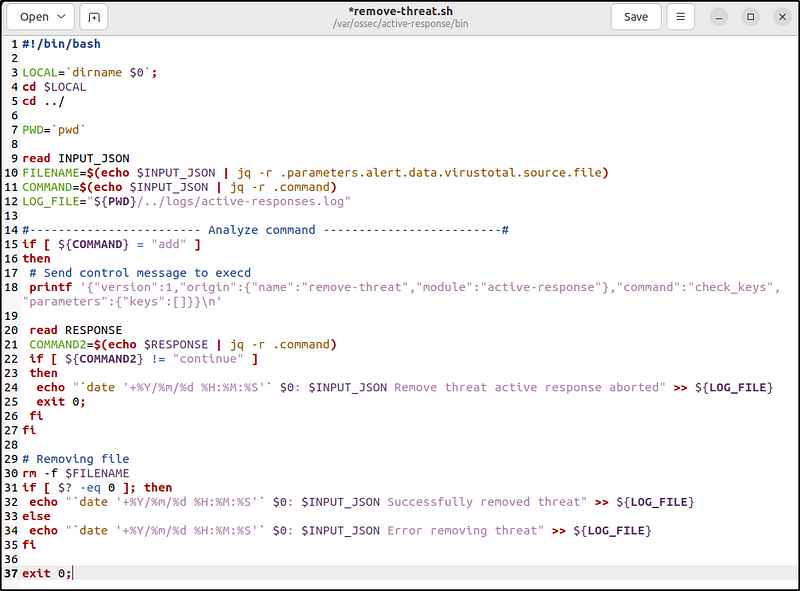
5. Change the /var/ossec/active-response/bin/remove-threat.sh file ownership, and permissions:
sudo chmod 750 /var/ossec/active-response/bin/remove-threat.sh

sudo chown root:wazuh /var/ossec/active-response/bin/remove-threat.sh
Chmod 750 (chmod a+rwx,g-w,o-rwx) means:
- (U)ser / owner can read, can write and can execute.
- (G)roup can read, can’t write and can execute.
- (O)thers can’t read, can’t write and can’t execute.
6. Restart the Wazuh agent to apply the changes:
Configuring the Wazuh server
Following are the steps on configuring the Wazuh server to alert for changes in the endpoint directory and enable the VirusTotal integration. These steps also enable and trigger the active response script whenever a suspicious file is detected.
1. Add the following rules to the /var/ossec/etc/rules/local_rules.xml file on the Wazuh server. These rules alert about changes in the /root directory that are detected by FIM scans:
<group name="syscheck,pci_dss_11.5,nist_800_53_SI.7,">
    <!-- Rules for Linux systems -->
    <rule id="100200" level="7">
        <if_sid>550</if_sid>
        <field name="file">/root</field>
        <description>File modified in /root directory.</description>
    </rule>
    <rule id="100201" level="7">
        <if_sid>554</if_sid>
        <field name="file">/root</field>
        <description>File added to /root directory.</description>
    </rule>
</group>
Save and restart the manager
2. Add the following configuration to the Wazuh server /var/ossec/etc/ossec.conf file to enable the Virustotal integration. I replaced <YOUR_VIRUS_TOTAL_API_KEY> with my VirusTotal API key. This allows to trigger a VirusTotal query whenever any of the rules 100200 and 100201 are triggered:
<ossec_config>
  <integration>
    <name>virustotal</name>
    <api_key><YOUR_VIRUS_TOTAL_API_KEY></api_key> <!-- Replace with your VirusTotal API key -->
    <rule_id>100200,100201</rule_id>
    <alert_format>json</alert_format>
  </integration>
</ossec_config>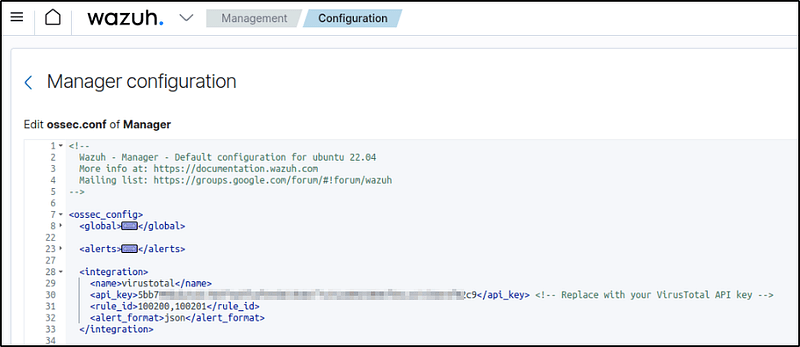
Note: The free VirusTotal API rate limits requests to four per minute. Premium VirusTotal API key, with a high frequency of queries allowed, would mean more rules can be added besides these two. Wazuh can also be configured to monitor more directories.
3. Append the following blocks to the Wazuh server /var/ossec/etc/ossec.conf file. This enables active response and triggers the remove-threat.sh script when VirusTotal flags a file as malicious:
<ossec_config>
  <command>
    <name>remove-threat</name>
    <executable>remove-threat.sh</executable>
    <timeout_allowed>no</timeout_allowed>
  </command>

<active-response>
    <disabled>no</disabled>
    <command>remove-threat</command>
    <location>local</location>
    <rules_id>87105</rules_id>
  </active-response>
</ossec_config>
Save and restart the manager
4. Add the following rules to the Wazuh server /var/ossec/etc/rules/local_rules.xml file to alert about the active response results:
<group name="virustotal,">
  <rule id="100092" level="12">
    <if_sid>657</if_sid>
    <match>Successfully removed threat</match>
    <description>$(parameters.program) removed threat located at $(parameters.alert.data.virustotal.source.file)</description>
  </rule>

<rule id="100093" level="12">
    <if_sid>657</if_sid>
    <match>Error removing threat</match>
    <description>Error removing threat located at $(parameters.alert.data.virustotal.source.file)</description>
  </rule>
</group>
5. Restart the Wazuh manager to apply the configuration changes:
Attack emulation
Download an EICAR test file to the /root directory on the Ubuntu endpoint:
sudo cd /root
sudo curl -LO https://secure.eicar.org/eicar.com && ls -lah eicar.com
From Wikipedia, “The EICAR Anti-Virus Test File or EICAR test file is a computer file that was developed by the European Institute for Computer Antivirus Research (EICAR) and Computer Antivirus Research Organization (CARO), to test the response of computer antivirus (AV) programs. Instead of using real malware, which could cause real damage, this test file allows people to test anti-virus software without having to use a real computer virus.
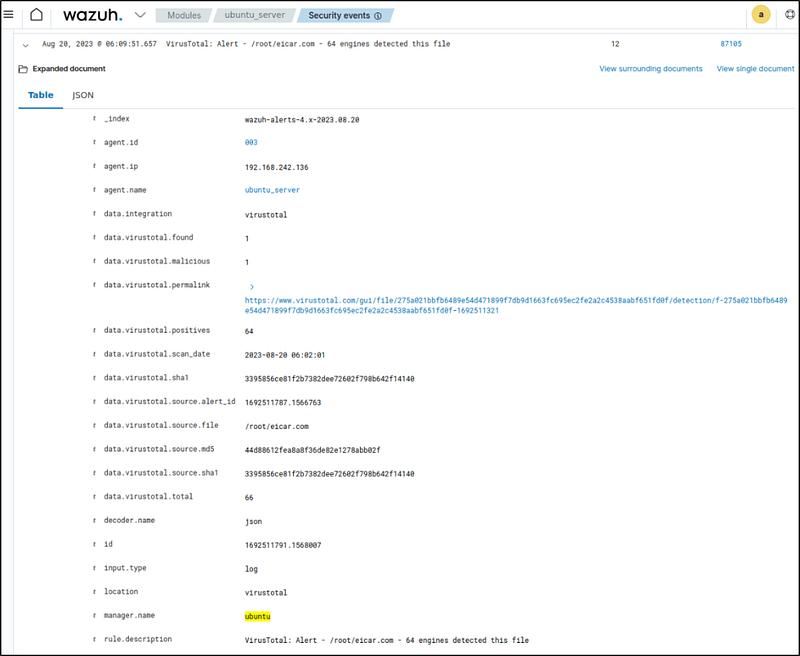
Visualize the alerts
Filter the Security events by adding the following filters in the search bar to query the alerts.
rule.id: is one of 553,100092,87105,100201- When a file was added to monitored directory, VirusTotal detected the change and generated an alert.
- It then activates the response of deleting the file and generated an alert which displays a successful threat removal.

Conclusion
When changes in the /root directory were detected, Wazuh automatically triggered a VirusTotal scan. I set up an active response to delete any files that VirusTotal flagged as malicious.
Trying this out, I copied a known malware sample onto my Ubuntu endpoint and Wazuh immediately detected the change, scanned the file, and deleted it — stopping the attack.
Automating the malware analysis and removal process allows much faster response time to threats.
Vulnerability detection
Wazuh scans endpoints for known vulnerabilities in installed software and the OS. This section will walk through detecting unpatched CVEs on a sample system. Keeping applications patched is critical for blocking exploit opportunities
For more information on this capability, check the vulnerability detection section of the documentation.
Configuring the Wazuh Server
Performed the following steps to enable the Wazuh Vulnerability Detector module. I already tackled how to configure the Wazuh Server in my blog post “ Wazuh | Part 2: Installing Wazuh and Configuring the Server”
1. Enable the Vulnerability Detector module in the /var/ossec/etc/ossec.conf file on the Wazuh server:\
<ossec_config>
  <vulnerability-detector>
    <enabled>yes</enabled>
    <interval>5m</interval>
    <min_full_scan_interval>6h</min_full_scan_interval>
    <run_on_start>yes</run_on_start>

    <!-- Ubuntu OS vulnerabilities -->
    <provider name="canonical">
    <enabled>yes</enabled>
    <os>trusty</os>
    <os>xenial</os>
    <os>bionic</os>
    <os>focal</os>
    <os>jammy</os>
    <update_interval>1h</update_interval>
    </provider>

    <!-- Debian OS vulnerabilities -->
    <provider name="debian">
    <enabled>yes</enabled>
    <os>buster</os>
    <os>bullseye</os>
    <update_interval>1h</update_interval>
    </provider>

    <!-- RedHat OS vulnerabilities -->
    <provider name="redhat">
    <enabled>yes</enabled>
    <os>5</os>
    <os>6</os>
    <os>7</os>
    <os>8</os>
    <os allow="CentOS Linux-8">8</os>
    <os>9</os>
    <update_interval>1h</update_interval>
    </provider>

    <!-- Windows OS vulnerabilities -->
    <provider name="msu">
    <enabled>yes</enabled>
    <update_interval>1h</update_interval>
    </provider>

    <!-- Aggregate vulnerabilities -->
    <provider name="nvd">
    <enabled>yes</enabled>
    <update_interval>1h</update_interval>
    </provider>
  </vulnerability-detector>
</ossec_config>
2. Restart the Wazuh manager to apply the configuration changes.
Test the configuration
No need to perform any actions. The Wazuh server will create a CVE database in /var/ossec/queue/vulnerabilities/cve.db. It performs vulnerability detection scans periodically for applications and operating systems on each monitored endpoint.
Note: Depending on the user’s network, it takes time to download the vulnerability database. And also more time to scan for vulnerable packages on the monitored endpoint.
Visualize the alerts
Fortunately, no vulnerabilities were detected in my Ubuntu endpoint.

For completeness, the image below, from documentation, displays vulnerabilities found in a system.

Conclusion
Wazuh scans for vulnerable software using data from security databases like NVD. I enabled vulnerability detection on my Ubuntu server, and Wazuh will scan for vulnerabilities in applications and operating system running on the Ubuntu endpoint
Vulnerability scanning is critical for understanding a system’s exposure to known weaknesses before adversaries can weaponize them.
Detecting malware using Yara integration
Wazuh integrates with Yara for custom malware detection on files. Yara creates signatures that classify and detect malware artifacts. This post will demonstrate using Yara rules with Wazuh to flag malware. The integration allows creating tailored detection policies to identify emerging malware strains.
To learn more about this integration with Wazuh, see the How to integrate Wazuh with YARA section of the documentation.
Configuring the Ubuntu endpoint
Perform the following steps to install YARA, and configure the active response and FIM modules.
1. Download, compile and install YARA:
sudo apt update
sudo apt install -y make gcc autoconf libtool libssl-dev pkg-config jq
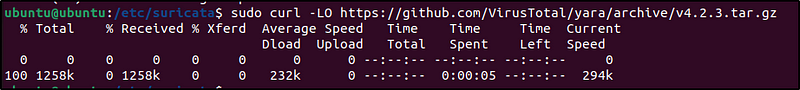
sudo curl -LO https://github.com/VirusTotal/yara/archive/v4.2.3.tar.gz
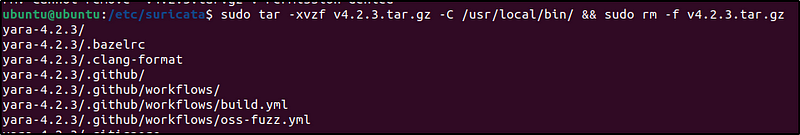
sudo tar -xvzf v4.2.3.tar.gz -C /usr/local/bin/ && sudo rm -f v4.2.3.tar.gz
cd /usr/local/bin/yara-4.2.3/
sudo ./bootstrap.sh && sudo ./configure && sudo make && sudo make install && sudo make check

2. Test that YARA is running properly:
yara
Outputyara:
wrong number of arguments Usage: yara [OPTION]... [NAMESPACE:]RULES_FILE... FILE | DIR | PID Try `--help` for more optionsIf the error message below is displayed:
/usr/local/bin/yara: error while loading shared libraries: libyara.so.9: cannot open shared object file: No such file or directory.This means that the loader doesn’t find the libyara library usually located in /usr/local/lib. Add the /usr/local/lib path to the /etc/ld.so.conf loader configuration file to solve this:
sudo su
echo "/usr/local/lib" >> /etc/ld.so.conf
ldconfig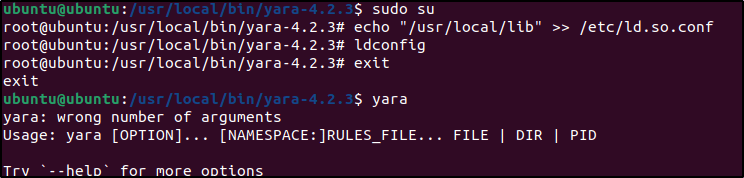
3. Switch back to the previous user.
sudo mkdir -p /tmp/yara/rules
sudo curl 'https://valhalla.nextron-systems.com/api/v1/get' \
-H 'Accept: text/html,application/xhtml+xml,application/xml;q=0.9,*/*;q=0.8' \
-H 'Accept-Language: en-US,en;q=0.5' \
--compressed \
-H 'Referer: https://valhalla.nextron-systems.com/' \
-H 'Content-Type: application/x-www-form-urlencoded' \
-H 'DNT: 1' -H 'Connection: keep-alive' -H 'Upgrade-Insecure-Requests: 1' \
--data 'demo=demo&apikey=1111111111111111111111111111111111111111111111111111111111111111&format=text' \
-o /tmp/yara/rules/yara_rules.yar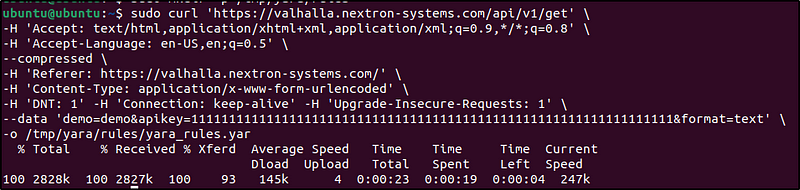
This set of commands basically downloads a set of yara rules.
4. Create a yara.sh script in the /var/ossec/active-response/bin/ directory. This script is designed to be invoked by the Wazuh manager as an active response to a security alert. It performs YARA scans on files using specified rules and logs any detected matches.
sudo gedit /var/ossec/active-response/bin/yara.sh#!/bin/bash
# Wazuh - Yara active response
# Copyright (C) 2015-2022, Wazuh Inc.
#
# This program is free software; you can redistribute it
# and/or modify it under the terms of the GNU General Public
# License (version 2) as published by the FSF - Free Software
# Foundation.
#------------------------- Gather parameters -------------------------#
# Extra arguments
read INPUT_JSON
YARA_PATH=$(echo $INPUT_JSON | jq -r .parameters.extra_args[1])
YARA_RULES=$(echo $INPUT_JSON | jq -r .parameters.extra_args[3])
FILENAME=$(echo $INPUT_JSON | jq -r .parameters.alert.syscheck.path)
# Set LOG_FILE path
LOG_FILE="logs/active-responses.log"
size=0
actual_size=$(stat -c %s ${FILENAME})
while [ ${size} -ne ${actual_size} ]; do
sleep 1
size=${actual_size}
actual_size=$(stat -c %s ${FILENAME})
done
#----------------------- Analyze parameters -----------------------#
if [[ ! $YARA_PATH ]] || [[ ! $YARA_RULES ]]
then
echo "wazuh-yara: ERROR - Yara active response error. Yara path and rules parameters are mandatory." >> ${LOG_FILE}
exit 1
fi
#------------------------- Main workflow --------------------------#
# Execute Yara scan on the specified filename
yara_output="$("${YARA_PATH}"/yara -w -r "$YARA_RULES" "$FILENAME")"
if [[ $yara_output != "" ]]
then
# Iterate every detected rule and append it to the LOG_FILE
while read -r line; do
echo "wazuh-yara: INFO - Scan result: $line" >> ${LOG_FILE}
done <<< "$yara_output"
fi
exit 0;
5. Change yara.sh file owner to root:wazuh and file permissions to 0750:sudo chown root:wazuh /var/ossec/active-response/bin/yara.sh
sudo chmod 750 /var/ossec/active-response/bin/yara.sh

Chmod 750 means:
- (U)ser / owner can read, can write and can execute.
- (G)roup can read, can’t write and can execute.
- (O)thers can’t read, can’t write and can’t execute.
6. Add the following within the <syscheck> block of the Wazuh agent /var/ossec/etc/ossec.conf configuration file to monitor the /tmp/yara/malware directory:
<directories realtime="yes">/tmp/yara/malware</directories>Added “whodata” to give additional context about the event.

7. Restart the Wazuh agent to apply the configuration changes:
Configuring the Wazuh server
Performed the following steps to configure Wazuh to alert for file changes in the Ubuntu endpoint’s /tmp/yara/malware directory. The steps also configure an active response script to trigger whenever a suspicious file is detected. I added the decoder.xml first, then created the rule, which is in reverse to what was given in the documentation.
1. Add the following decoders to the Wazuh server /var/ossec/etc/decoders/local_decoder.xml file. This allows extracting the information from YARA scan results:
<decoder name="yara_decoder">
  <prematch>wazuh-yara:</prematch>
</decoder>

<decoder name="yara_decoder1">
  <parent>yara_decoder</parent>
  <regex>wazuh-yara: (\S+) - Scan result: (\S+) (\S+)</regex>
  <order>log_type, yara_rule, yara_scanned_file</order>
</decoder>
2. Add the following rules to the /var/ossec/etc/rules/local_rules.xml file. The rules detect FIM events in the monitored directory. They also alert when the YARA integration finds malware. This can be modified to include rules to detect events from other directories:
<group name="syscheck,">
  <rule id="100300" level="7">
    <if_sid>550</if_sid>
    <field name="file">/tmp/yara/malware/</field>
    <description>File modified in /tmp/yara/malware/ directory.</description>
  </rule>
  <rule id="100301" level="7">
    <if_sid>554</if_sid>
    <field name="file">/tmp/yara/malware/</field>
    <description>File added to /tmp/yara/malware/ directory.</description>
  </rule>
</group>

<group name="yara,">
  <rule id="108000" level="0">
    <decoded_as>yara_decoder</decoded_as>
    <description>Yara grouping rule</description>
  </rule>
  <rule id="108001" level="12">
    <if_sid>108000</if_sid>
    <match>wazuh-yara: INFO - Scan result: </match>
    <description>File "$(yara_scanned_file)" is a positive match. Yara rule: $(yara_rule)</description>
  </rule>
</group>
3. Add the following configuration to the Wazuh server /var/ossec/etc/ossec.conf configuration file. This configures the active response module to trigger after the rule 100300 and 100301 are fired:
<ossec_config>
  <command>
    <name>yara_linux</name>
    <executable>yara.sh</executable>
    <extra_args>-yara_path /usr/local/bin -yara_rules /tmp/yara/rules/yara_rules.yar</extra_args>
    <timeout_allowed>no</timeout_allowed>
  </command>

<active-response>
    <command>yara_linux</command>
    <location>local</location>
    <rules_id>100300,100301</rules_id>
  </active-response>
</ossec_config>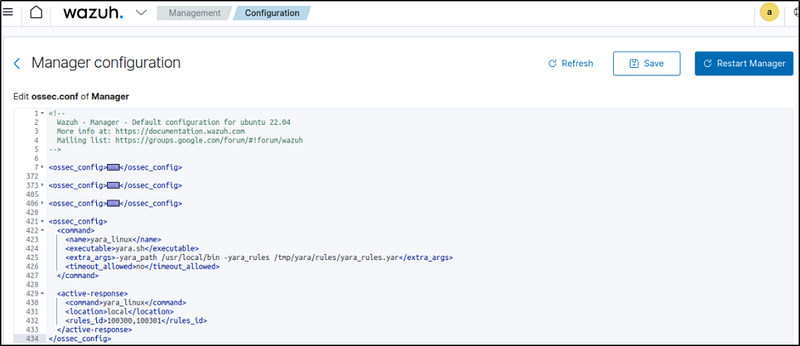
4.Restart the Wazuh manager to apply the configuration changes:
Attack emulation
1. Create the directory then the script /tmp/yara/malware/malware_downloader.sh on the monitored endpoint to download malware samples. The script is a Malware downloader.
sudo mkdir /tmp/yara/malware
sudo gedit /tmp/yara/malware/malware_downloader.sh
#!/bin/bash
# Wazuh - Malware Downloader for test purposes
# Copyright (C) 2015-2022, Wazuh Inc.
#
# This program is free software; you can redistribute it
# and/or modify it under the terms of the GNU General Public
# License (version 2) as published by the FSF - Free Software
# Foundation.
function fetch_sample(){
curl -s -XGET "$1" -o "$2"
}
echo "WARNING: Downloading Malware samples, please use this script with caution."
read -p " Do you want to continue? (y/n)" -n 1 -r ANSWER
echo
if [[ $ANSWER =~ ^[Yy]$ ]]
then
echo
# Mirai
echo "# Mirai: https://en.wikipedia.org/wiki/Mirai_(malware)"
echo "Downloading malware sample..."
fetch_sample "https://wazuh-demo.s3-us-west-1.amazonaws.com/mirai" "/tmp/yara/malware/mirai" && echo "Done!" || echo "Error while downloading."
echo
# Xbash
echo "# Xbash: https://unit42.paloaltonetworks.com/unit42-xbash-combines-botnet-ransomware-coinmining-worm-targets-linux-windows/"
echo "Downloading malware sample..."
fetch_sample "https://wazuh-demo.s3-us-west-1.amazonaws.com/xbash" "/tmp/yara/malware/xbash" && echo "Done!" || echo "Error while downloading."
echo
# VPNFilter
echo "# VPNFilter: https://news.sophos.com/en-us/2018/05/24/vpnfilter-botnet-a-sophoslabs-analysis/"
echo "Downloading malware sample..."
fetch_sample "https://wazuh-demo.s3-us-west-1.amazonaws.com/vpn_filter" "/tmp/yara/malware/vpn_filter" && echo "Done!" || echo "Error while downloading."
echo
# Webshell
echo "# WebShell: https://github.com/SecWiki/WebShell-2/blob/master/Php/Worse%20Linux%20Shell.php"
echo "Downloading malware sample..."
fetch_sample "https://wazuh-demo.s3-us-west-1.amazonaws.com/webshell" "/tmp/yara/malware/webshell" && echo "Done!" || echo "Error while downloading."
echo
fi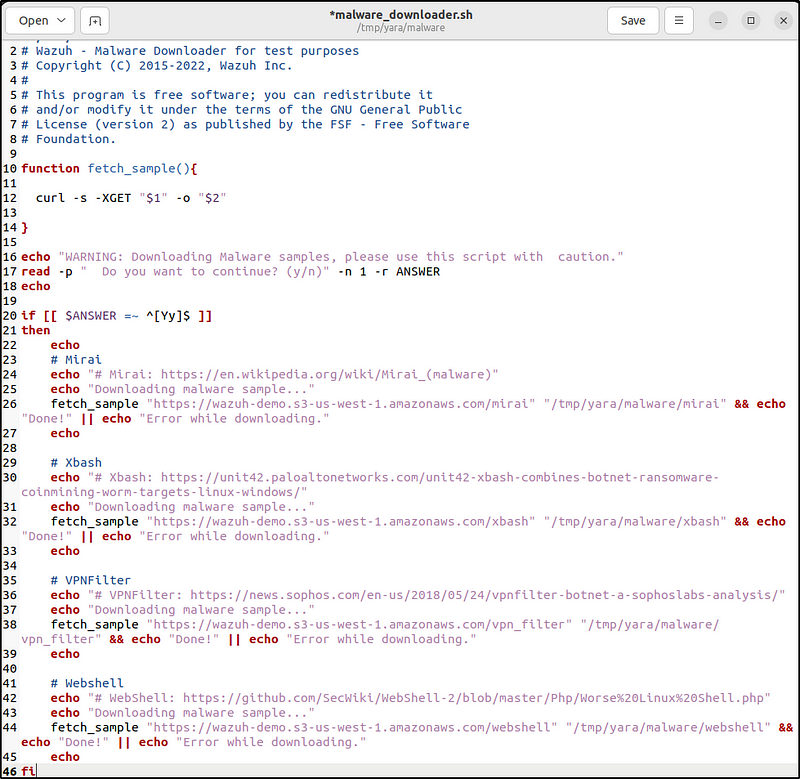
2. Run the malware_downloader.sh script to download malware samples to the /tmp/yara/malware directory:
sudo bash /tmp/yara/malware/malware_downloader.sh
Visualize the alerts
The alerts display events that shows Yara positively identifying the downloaded Malware.
rule.groups:yara

Conclusion
Yara rules allow creating customized malware signatures tailored to security needs. I integrated Wazuh with Yara and created a rule to flag dowloaded malware samples.
When I tested this out on an endpoint, Wazuh used the Yara rule to immediately detect the malwares and generated alerts that contains the identity of the malwares.
By leveraging Yara, Wazuh can identify emerging or specially crafted malware strains based on new signatures developed by the security team.
Detecting hidden processes
Malware like rootkits can conceal running processes. Wazuh uses system call monitoring to reveal hidden process activity indicative of Linux rootkits.
A sample rootkit is deployed on the Ubuntu endpoiont that hides processes and kernel modules. By analyzing system calls, Wazuh will detect the rootkit despite its evasion attempts. Wazuh detects it using setsid(), getpid(), and kill() system calls.
The Malware detection section of our documentation contains more details about how the Wazuh detects malware and the rootcheck module.
Configuring the Ubuntu endpoint
Download, compile, and load a rootkit on this endpoint. Then, configure the Wazuh rootcheck module for anomaly detection.
The following are the steps to emulate a rootkit, and to run a rootcheck scan to detect it.
1. Switch to the root user and update the kernel of this endpoint:
sudo su apt update2. Install packages required for building the rootkit:
apt -y install gcc git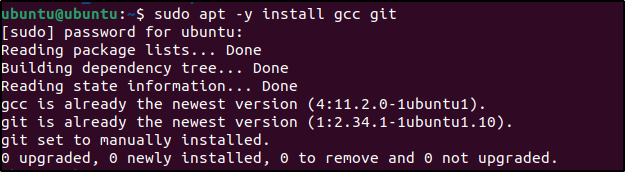
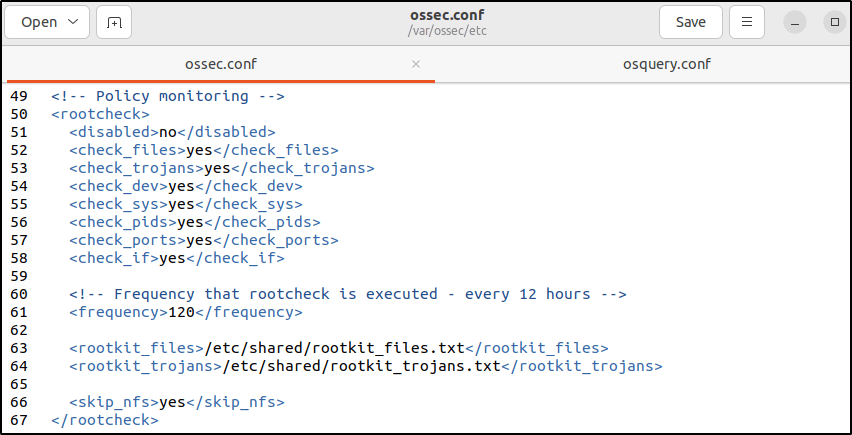
3. Next, configure the Wazuh agent to run rootcheck scans every 2 minutes. In the /var/ossec/etc/ossec.conf file. Set the frequency option in the <rootcheck> section to 120:
<rootcheck>
  <disabled>no</disabled>
  <check_files>yes</check_files>
  <check_trojans>yes</check_trojans>
  <check_dev>yes</check_dev>
  <check_sys>yes</check_sys>
  <check_pids>yes</check_pids>
  <check_ports>yes</check_ports>
  <check_if>yes</check_if>

  <!-- rootcheck execution frequency - every 12 hours by default-->

  <frequency>120</frequency>

  <rootkit_files>etc/shared/rootkit_files.txt</rootkit_files>
  <rootkit_trojans>etc/shared/rootkit_trojans.txt</rootkit_trojans>
  <skip_nfs>yes</skip_nfs>
</rootcheck>
4. Configure options for Rootcheck.
Refer to this section above Detecting suspicious binaries where I already configured the options.
5. Restart the Wazuh agent to apply the changes:
Attack emulation
1. On the Ubuntu endpont ,fetch the Diamorphine rootkit source code from GitHub:
git clone https://github.com/m0nad/Diamorphine2.Navigate to the Diamorphine directory and compile the source code:cd Diamorphinemake
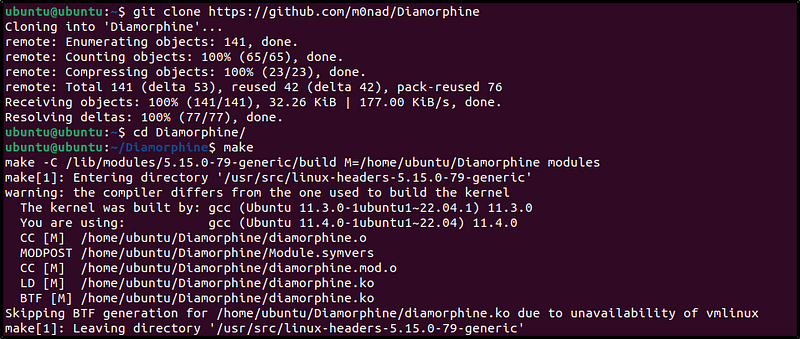
3. Load the rootkit kernel module:sudo insmod diamorphine.ko

The kernel-level rootkit “Diamorphine” is now installed on the Ubuntu endpoint.
4. Run the kill signal 63 with the PID of a random process running on the Ubuntu endpoint. This unhides the Diamorphine rootkit. By default, Diamorphine hides itself so it won’t be detected by running the lsmod command.
lsmod | grep diamorphine
kill -63 509
lsmod | grep diamorphine
Output:
diamorphine 16384 0When using these last commands, an empty output may be expected. In the case of Diamorphine, any kill signal 63 sent to any process whether it exists or not, toggles the Diamorphine kernel module to hide or unhide.
5. Run the following commands to see how the rsyslogd process is first visible and then no longer visible. This rootkit allows you to hide selected processes from the ps command. Sending a kill signal 31 hides/unhides any process.
ps auxw | grep rsyslogd | grep -v grepOutput:
root 732 0.0 0.7 214452 3572 ? Ssl 14:53 0:00 /usr/sbin/rsyslogd -nkill -31 <PID_OF_RSYSLOGD>
ps auxw | grep rsyslog | grep -v grep
When using this last command, an empty output can be expected.
The next rootcheck scan will run and alert us about the rsyslogd process which was hidden with the Diamorphine rootkit.
Visualize the alerts
Filter the alerts in the Security events module.
rule.groups:rootcheck

If the same kill -31 command is executed against rsyslogd, the rsyslogd process becomes visible again. The subsequent rootcheck scan would no longer generate alerts about it.
Conclusion
Deploying a sample rootkit on my Ubuntu endpoint, it was able to hide running processes from standard detection tools. However, Wazuh uses its Malware Detection engine to analyze system calls, spotting the hidden process and alerting on the rootkit.Detecting obscured threats like cloaked processes further strengthens endpoint security monitoring.
Conclusion
In this post, I demonstrated practical examples of Wazuh’s security capabilities using common threat scenarios. The Network IDS integration with Suricata provided expanded visibility by correlating network and endpoint events. Wazuh alerted on SQL injection attack patterns in web logs and suspicious binaries indicative of malware.
Integrating VirusTotal enabled automatically detecting and removing malware with file integrity monitoring. Wazuh scanned for software vulnerabilities and will identify unpatched CVEs. Integrating Yara rules for malware detection. And Wazuh revealed hidden processes cloaked by Linux rootkits using system call analysis.
These use cases highlighted Wazuh’s versatile security toolbox to address a wide range of threats out of the box. From network monitoring to endpoint detection and response, Wazuh provides unified visibility and protection. This hands-on experience demonstrated Wazuh’s capabilities to strengthen enterprise security in impactful ways.
Reference
Thanks for Reading. Till next time.

Leave a reply to Teil 4/2 der Blogserie – Wazuh-Blog Cancel reply